Close the gap between strategy and work.
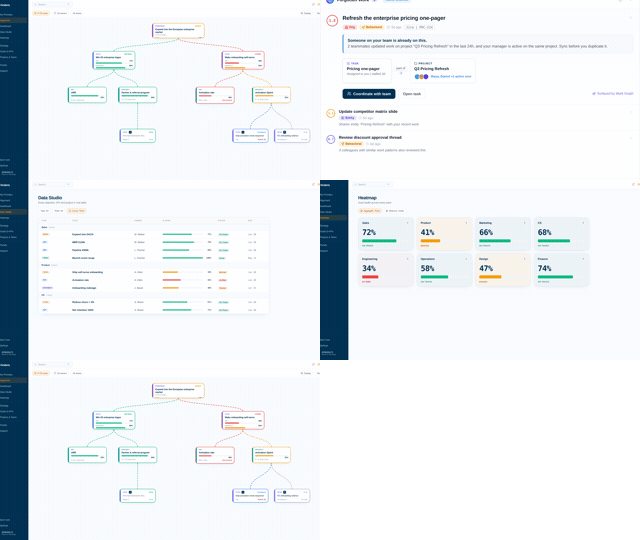
Vindaris aligns daily team work with company goals by analyzing messy context from projects, chats, and meetings in the AI Work Graph - surfacing strategy execution risks and everyone's highest priority work, every day.
Prefer a walkthrough? Schedule a demo call





Built for the moments your strategy actually lives in.
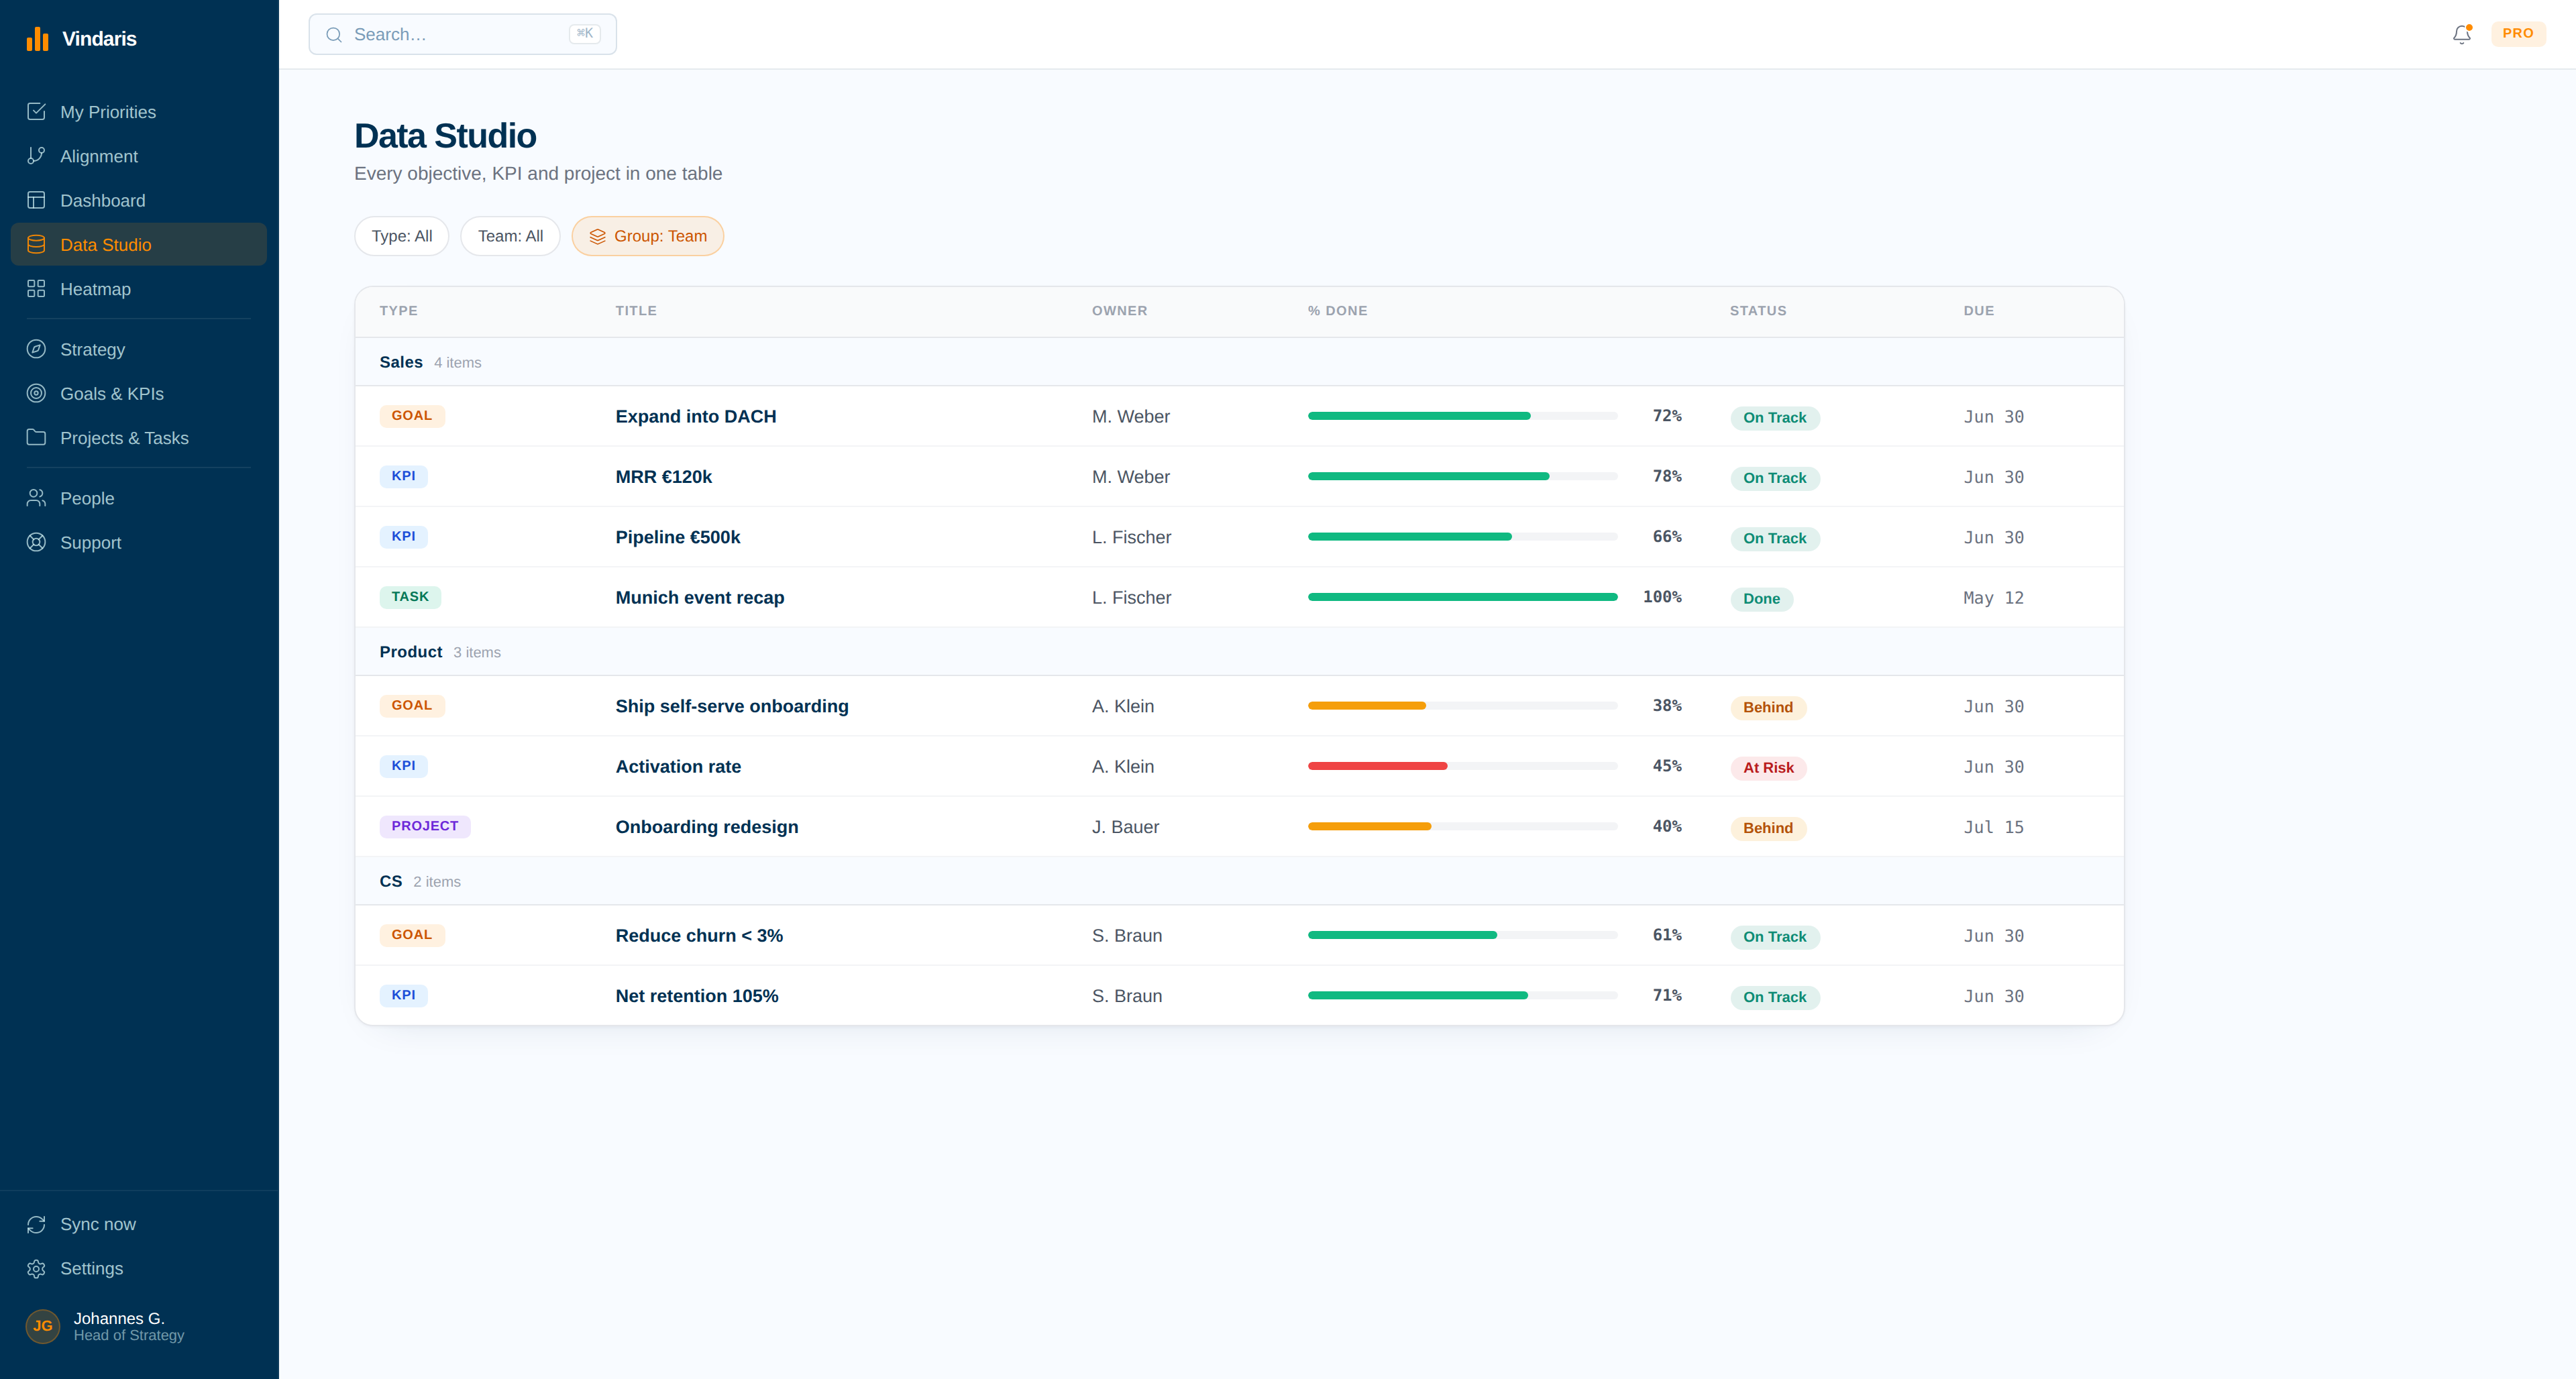
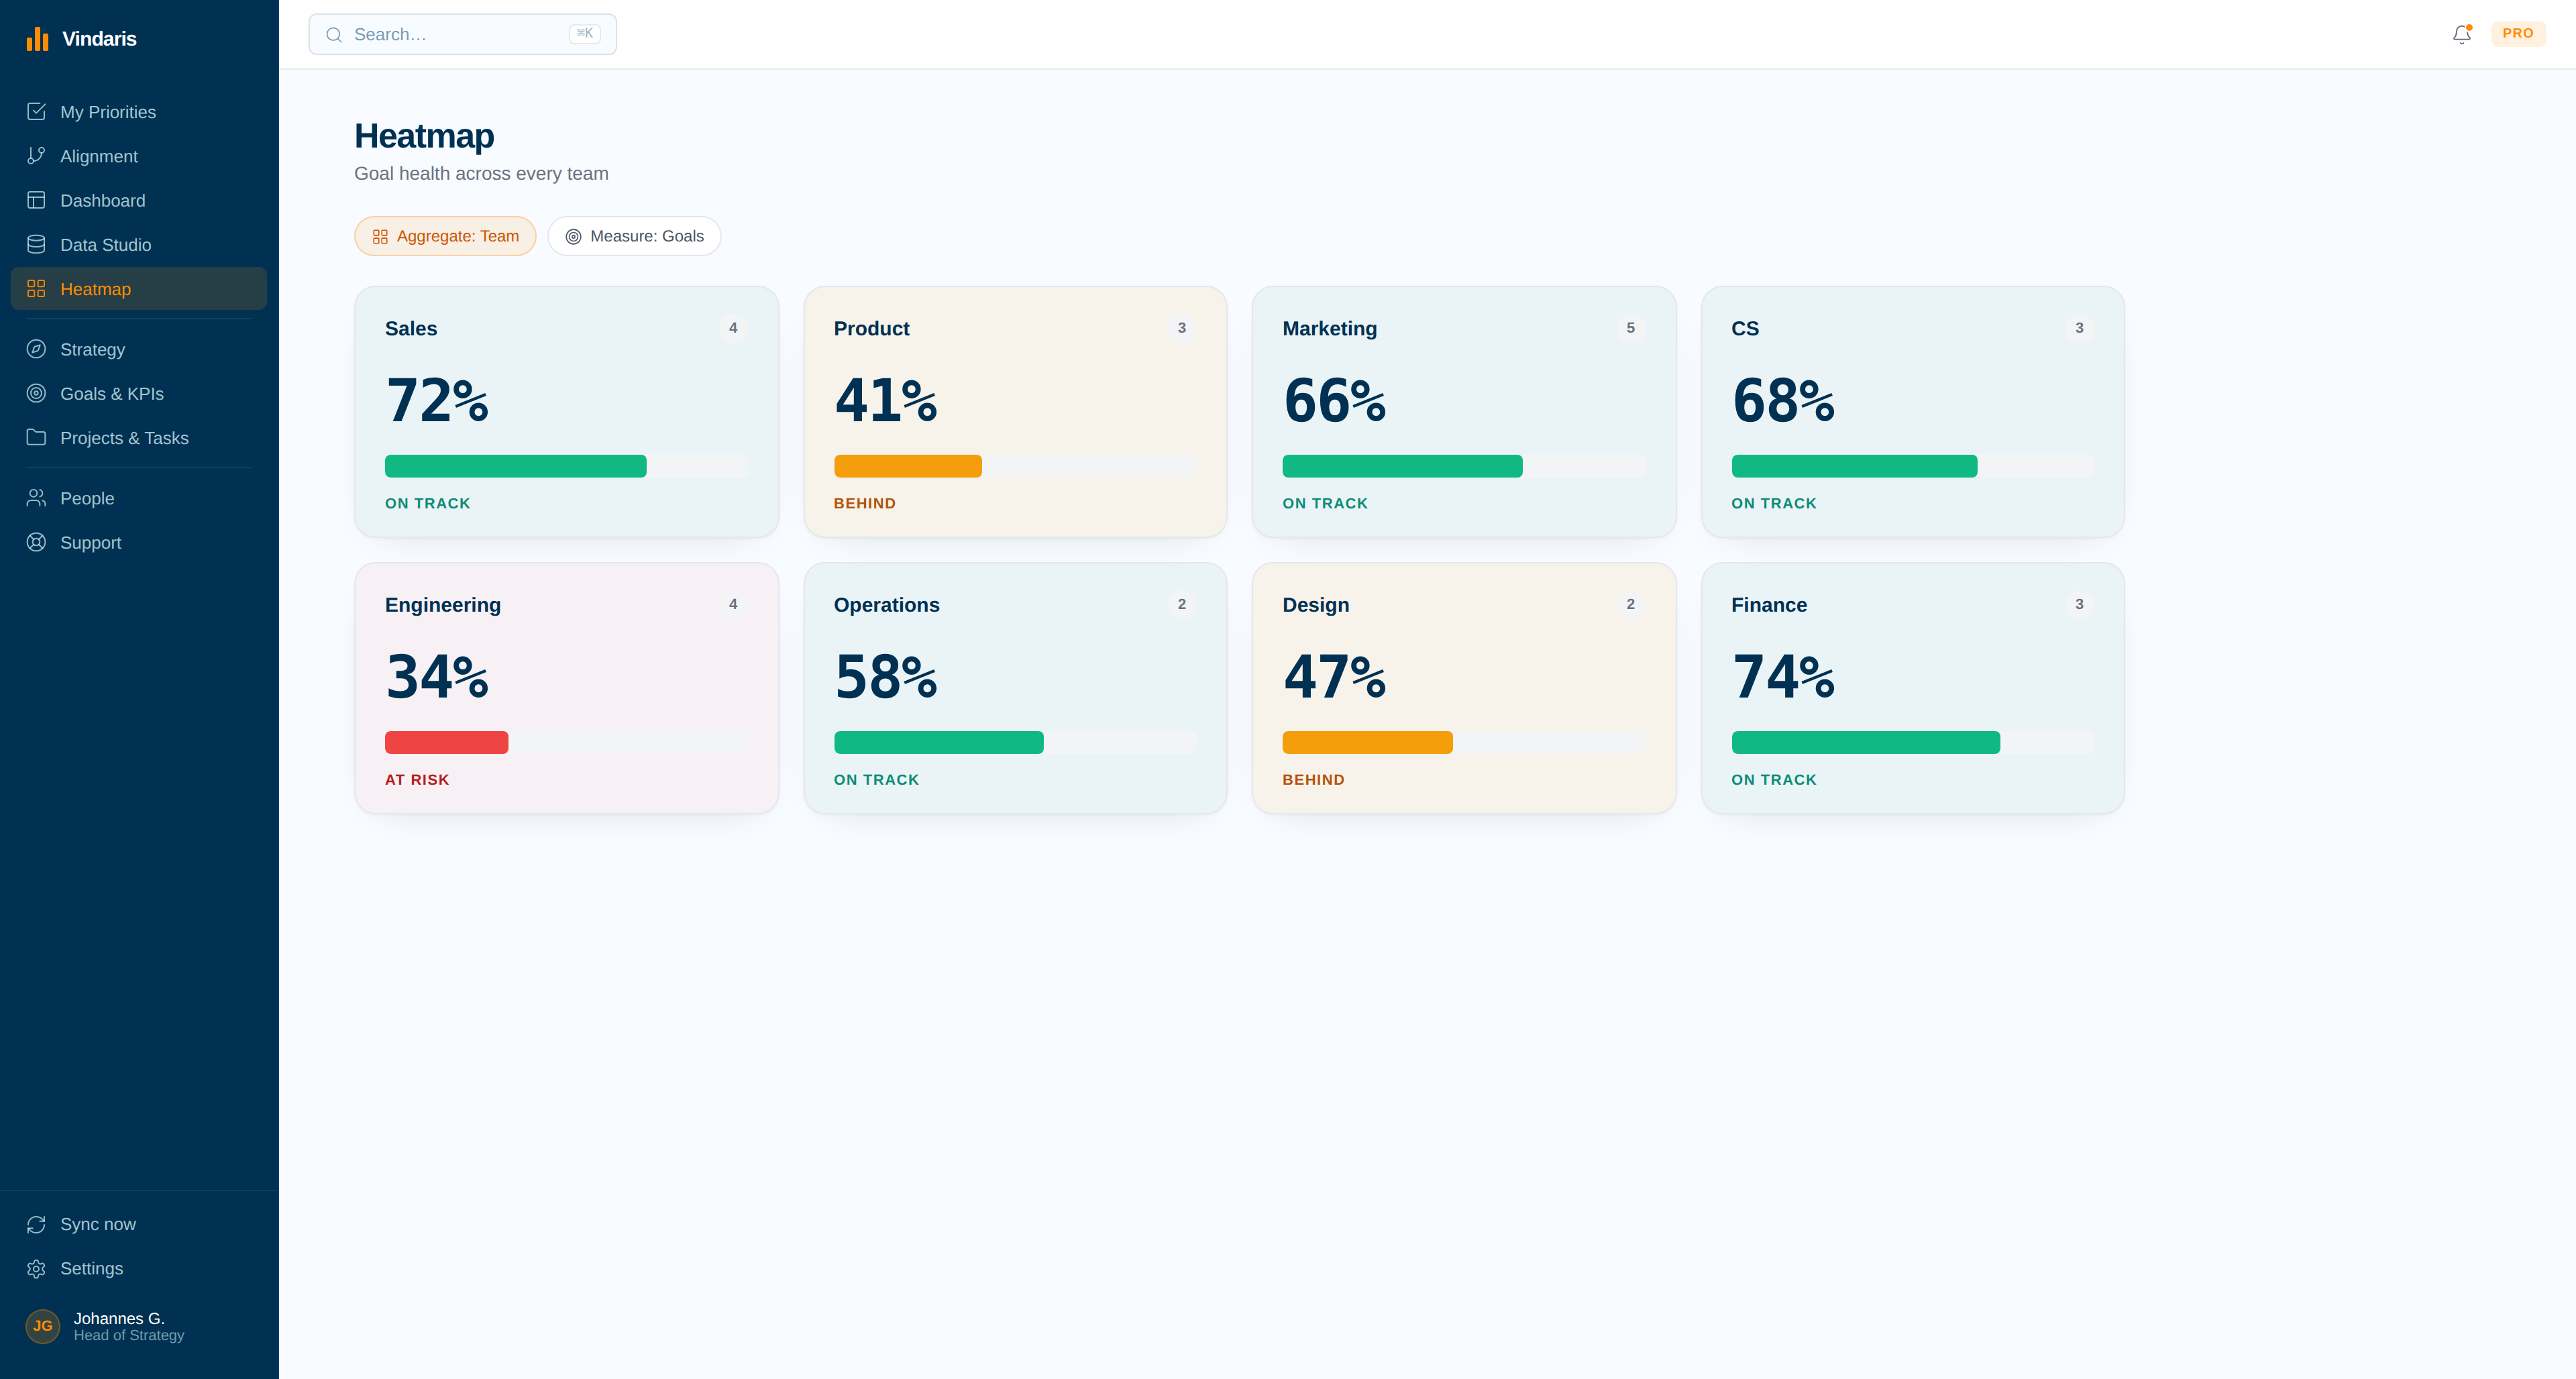
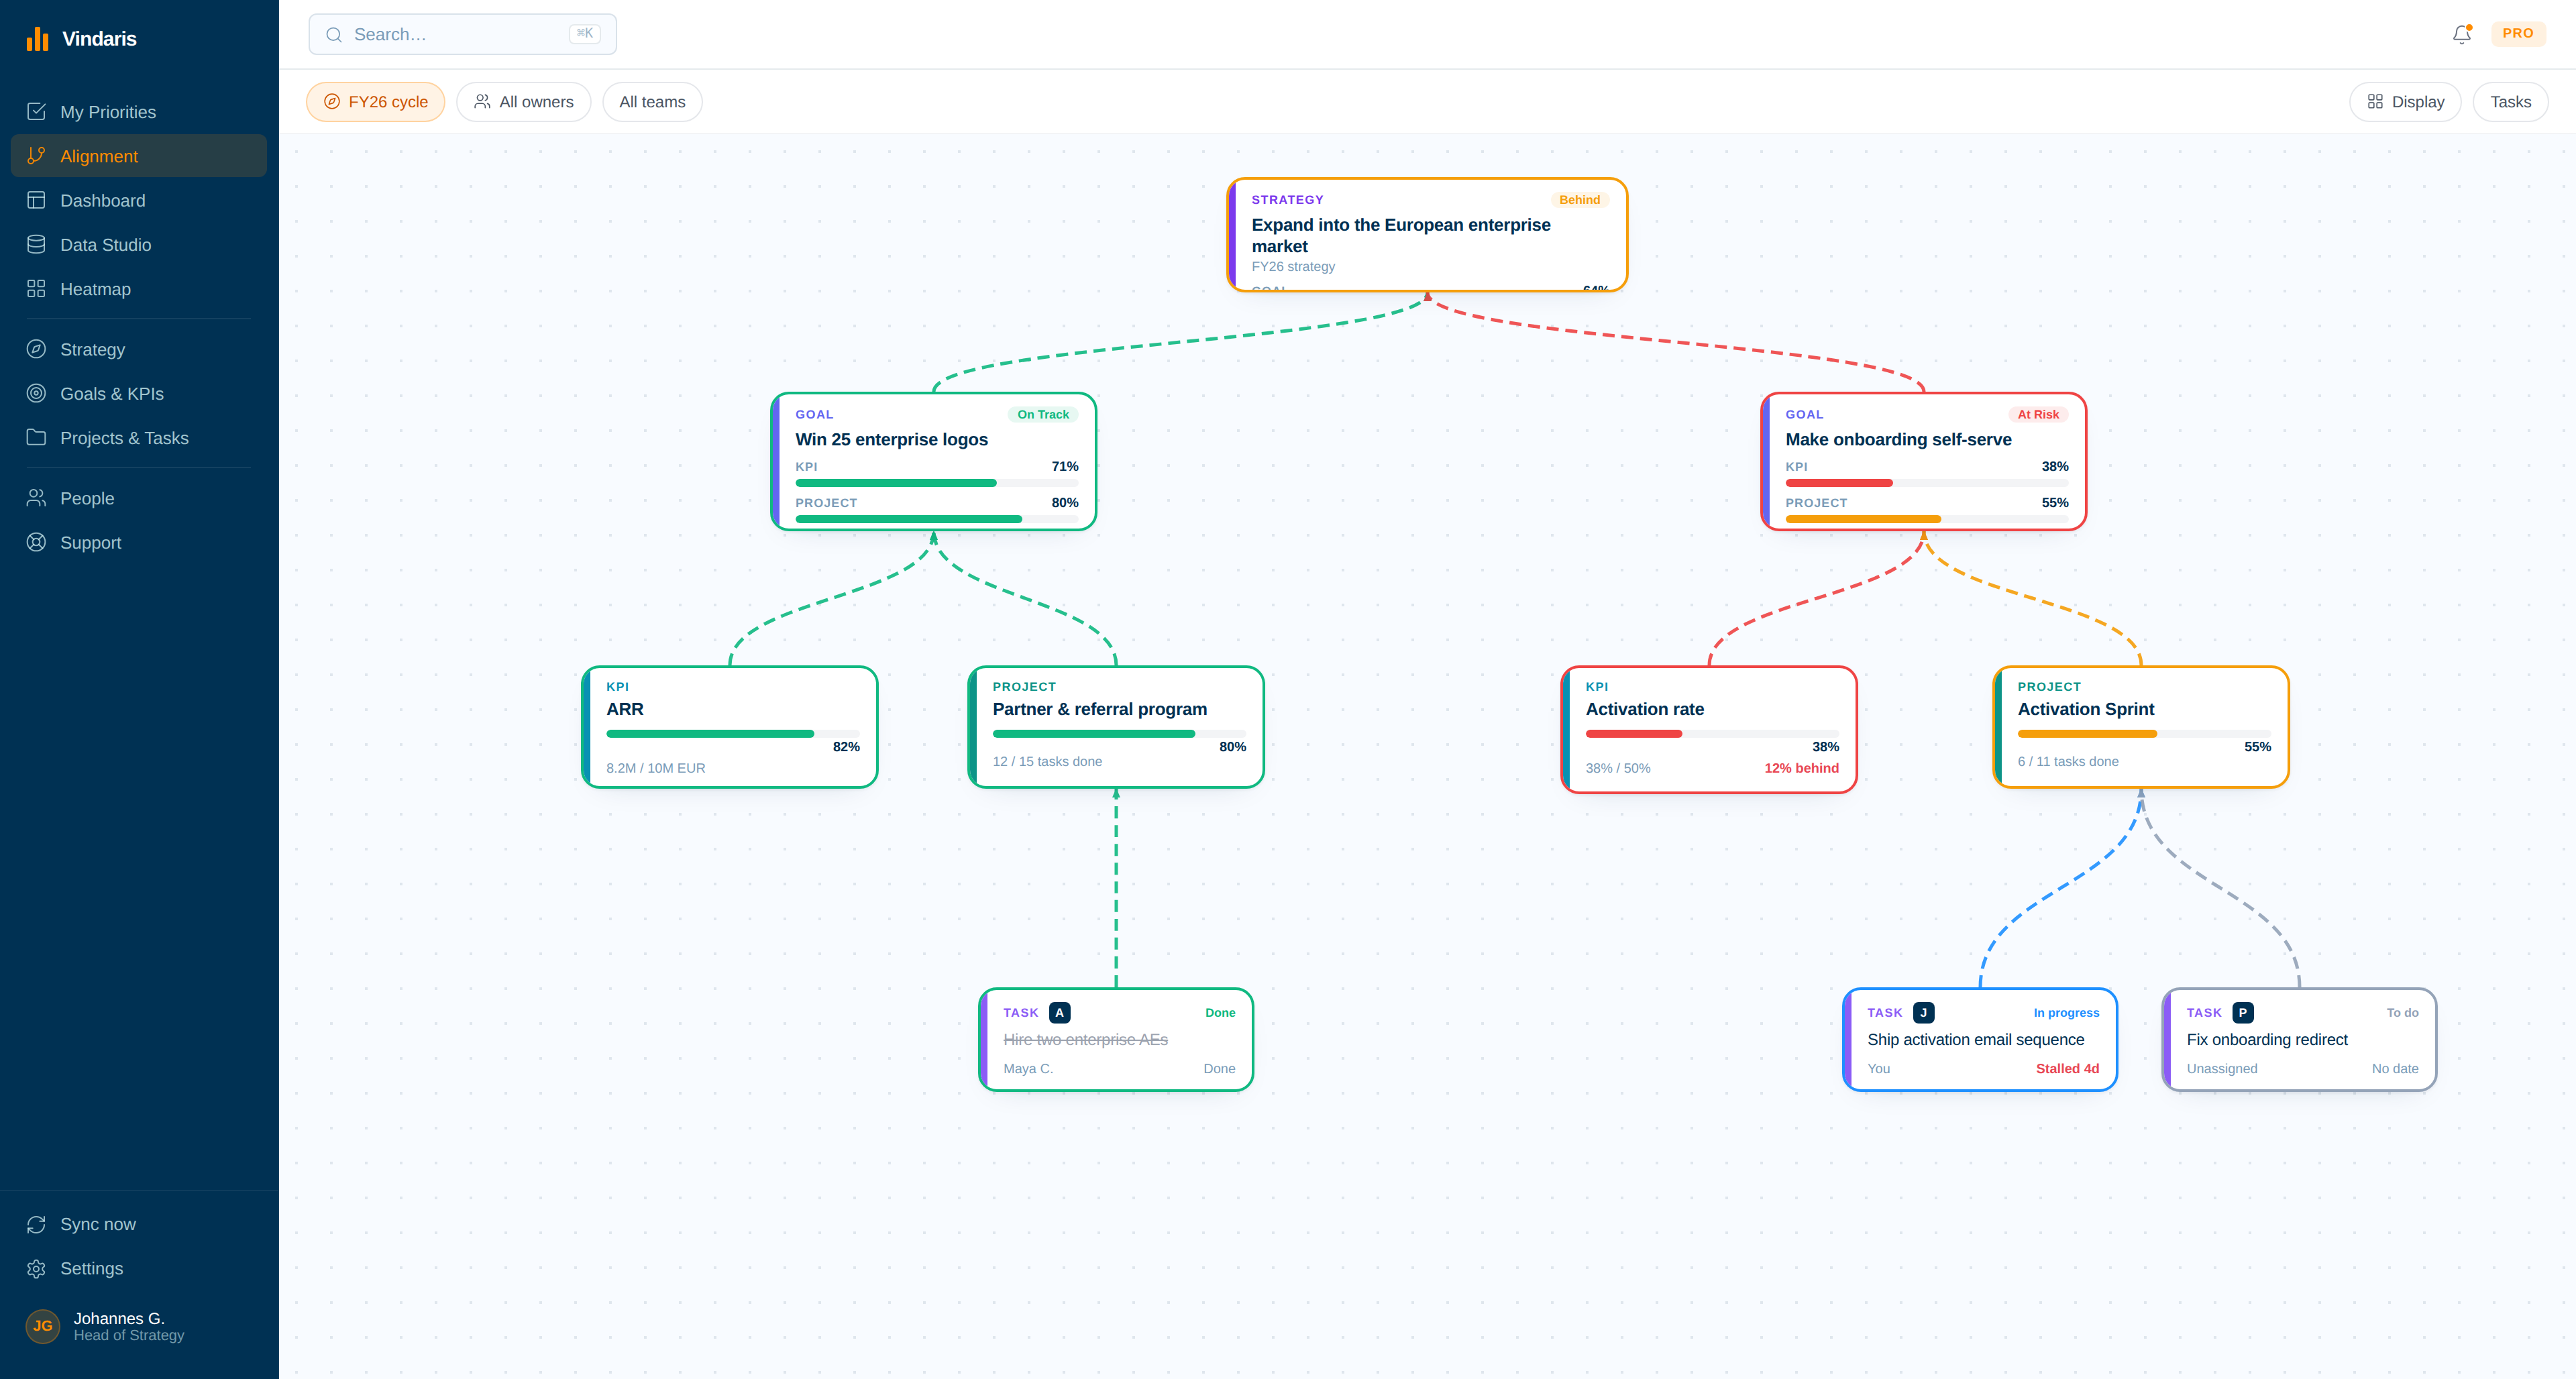
One connected system, from strategy down to a single task.
Goals and work in one graph
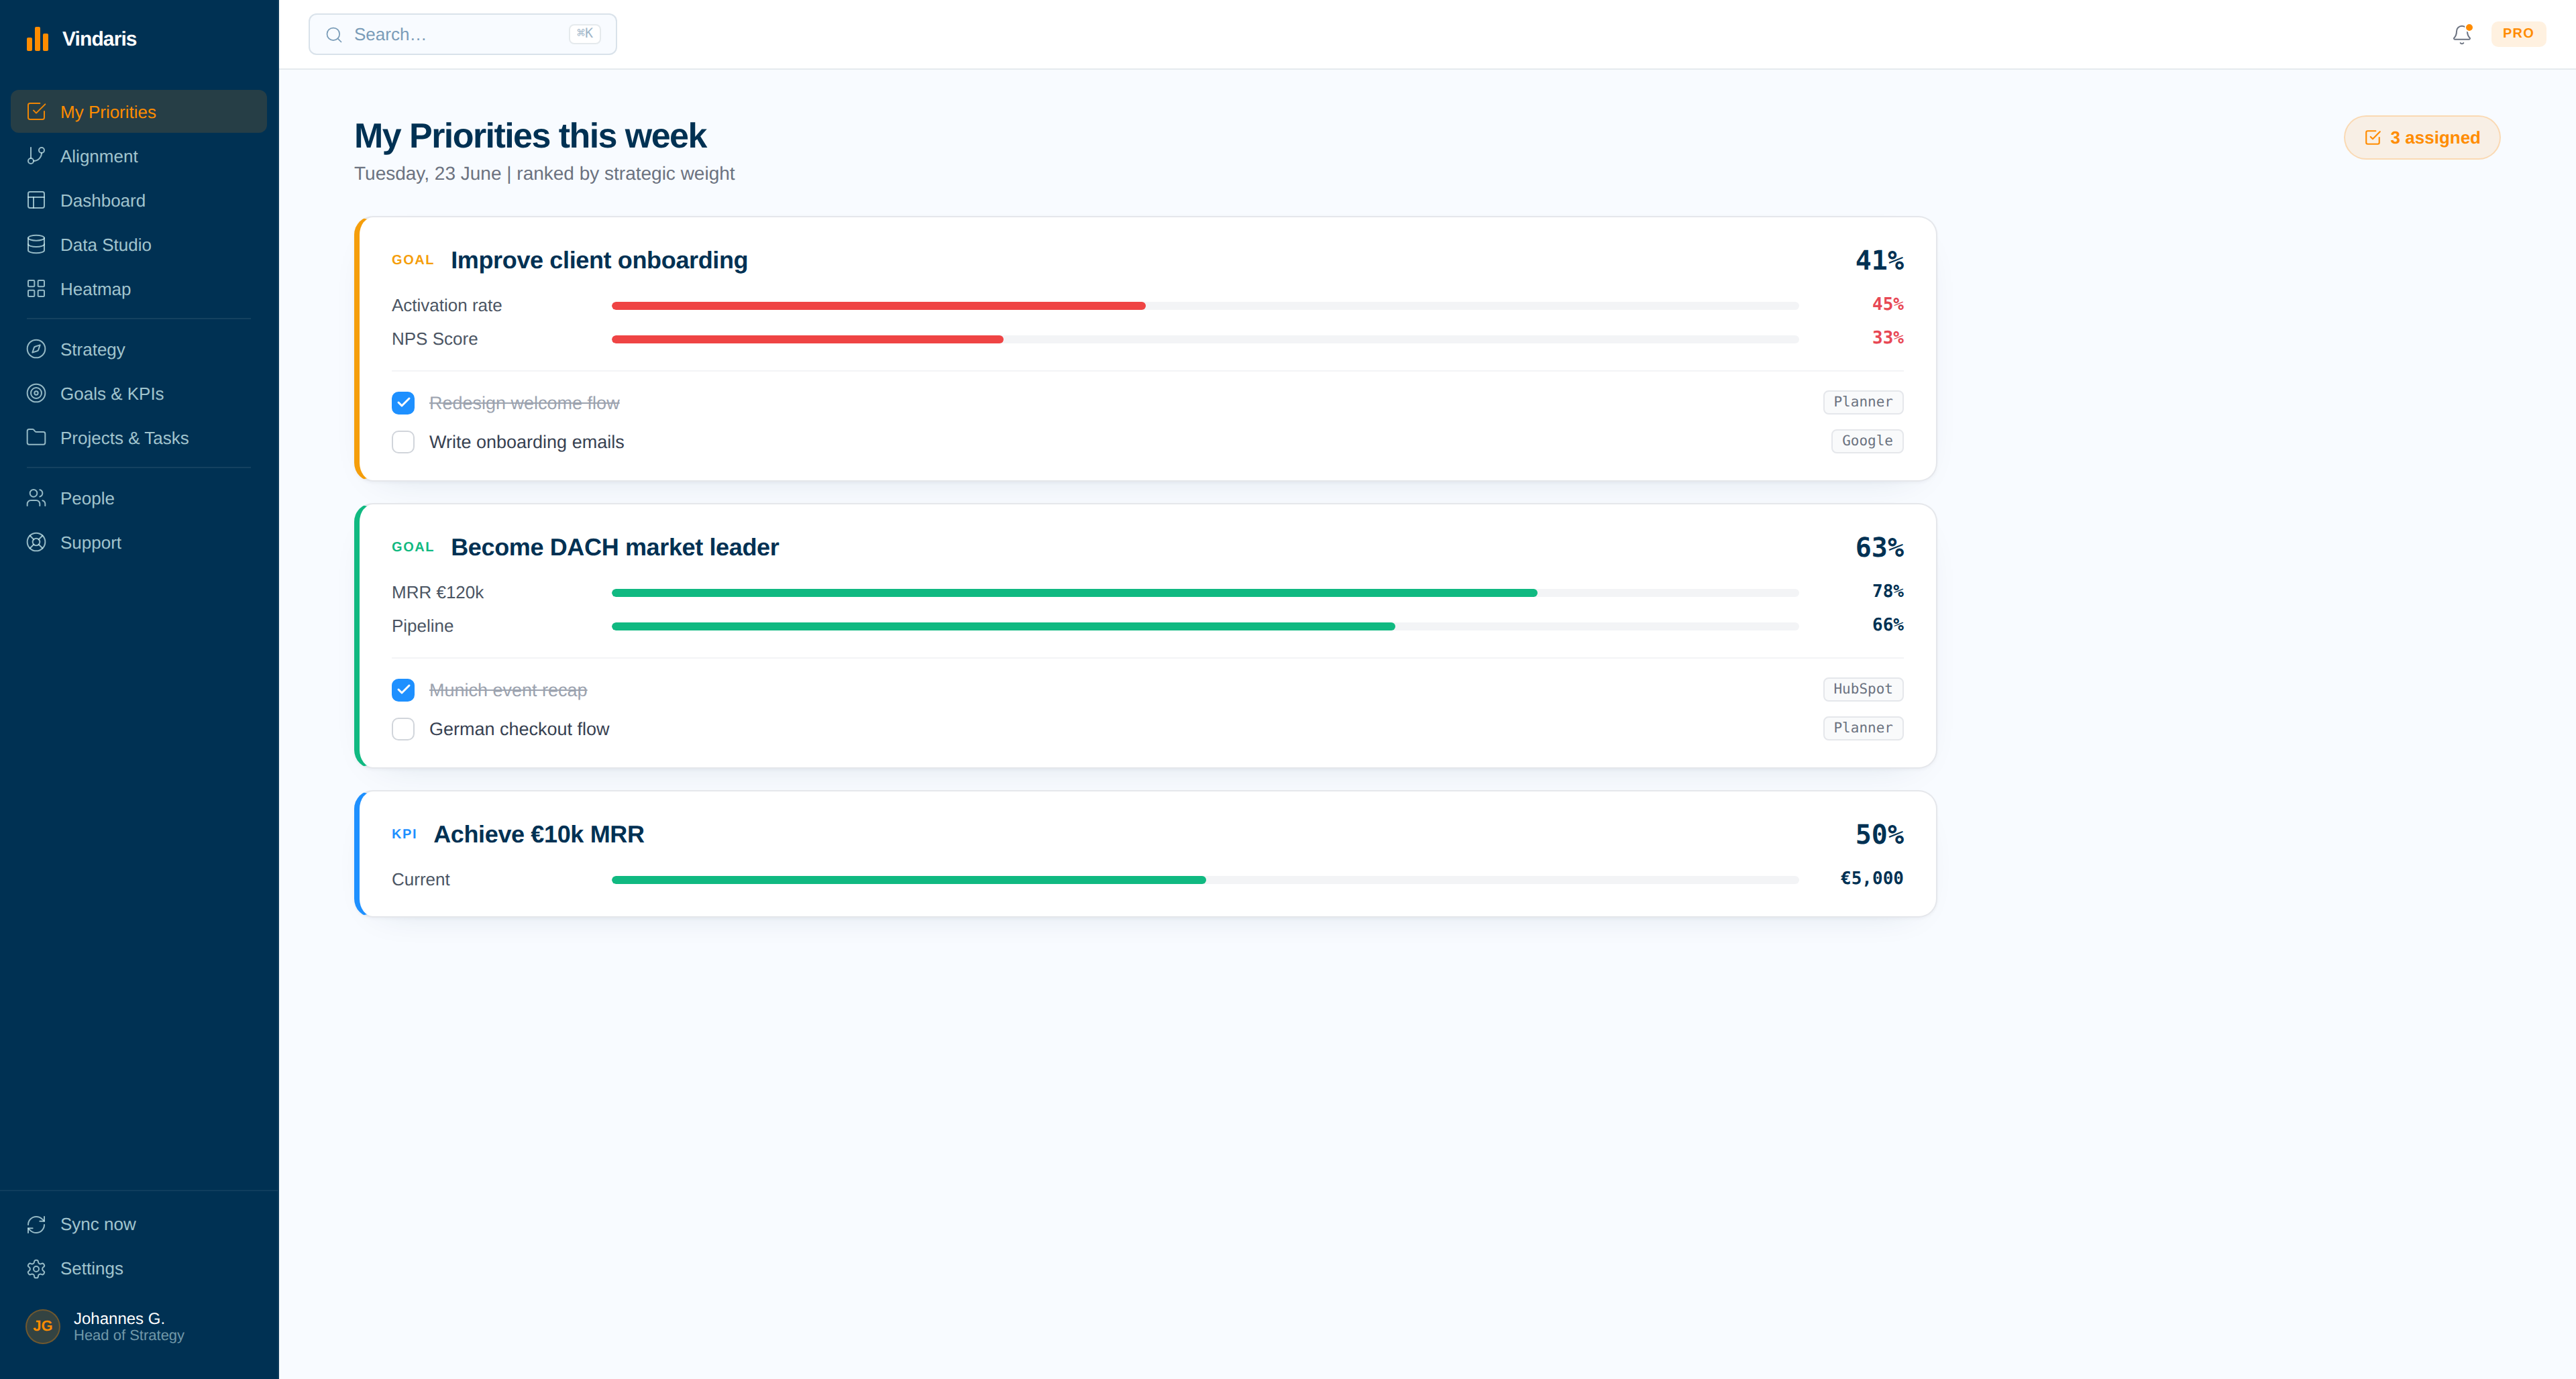
Strategies, goals, KPIs, projects and tasks connect on an open canvas with no fixed hierarchy or goal syntax. Rename every level to match how your company already speaks.
Risk that finds you first
The Work Graph reads the edges between your goals and the work beneath them, then alerts the owner when connected work slips, a routine breaks, or focus drifts, with the reason attached.
Work stays where it lives
Connect HubSpot, Jira, Planner, Asana, Google Tasks and more. Sync runs both directions, so teams never migrate and every item keeps a tag pointing back to its source.
Build the map of your strategy, then let progress roll up through it.
Create strategies, goals, KPIs, projects and tasks as cards and drag connections between them. When a task closes, its project moves, and the KPIs and goals above it update with it.
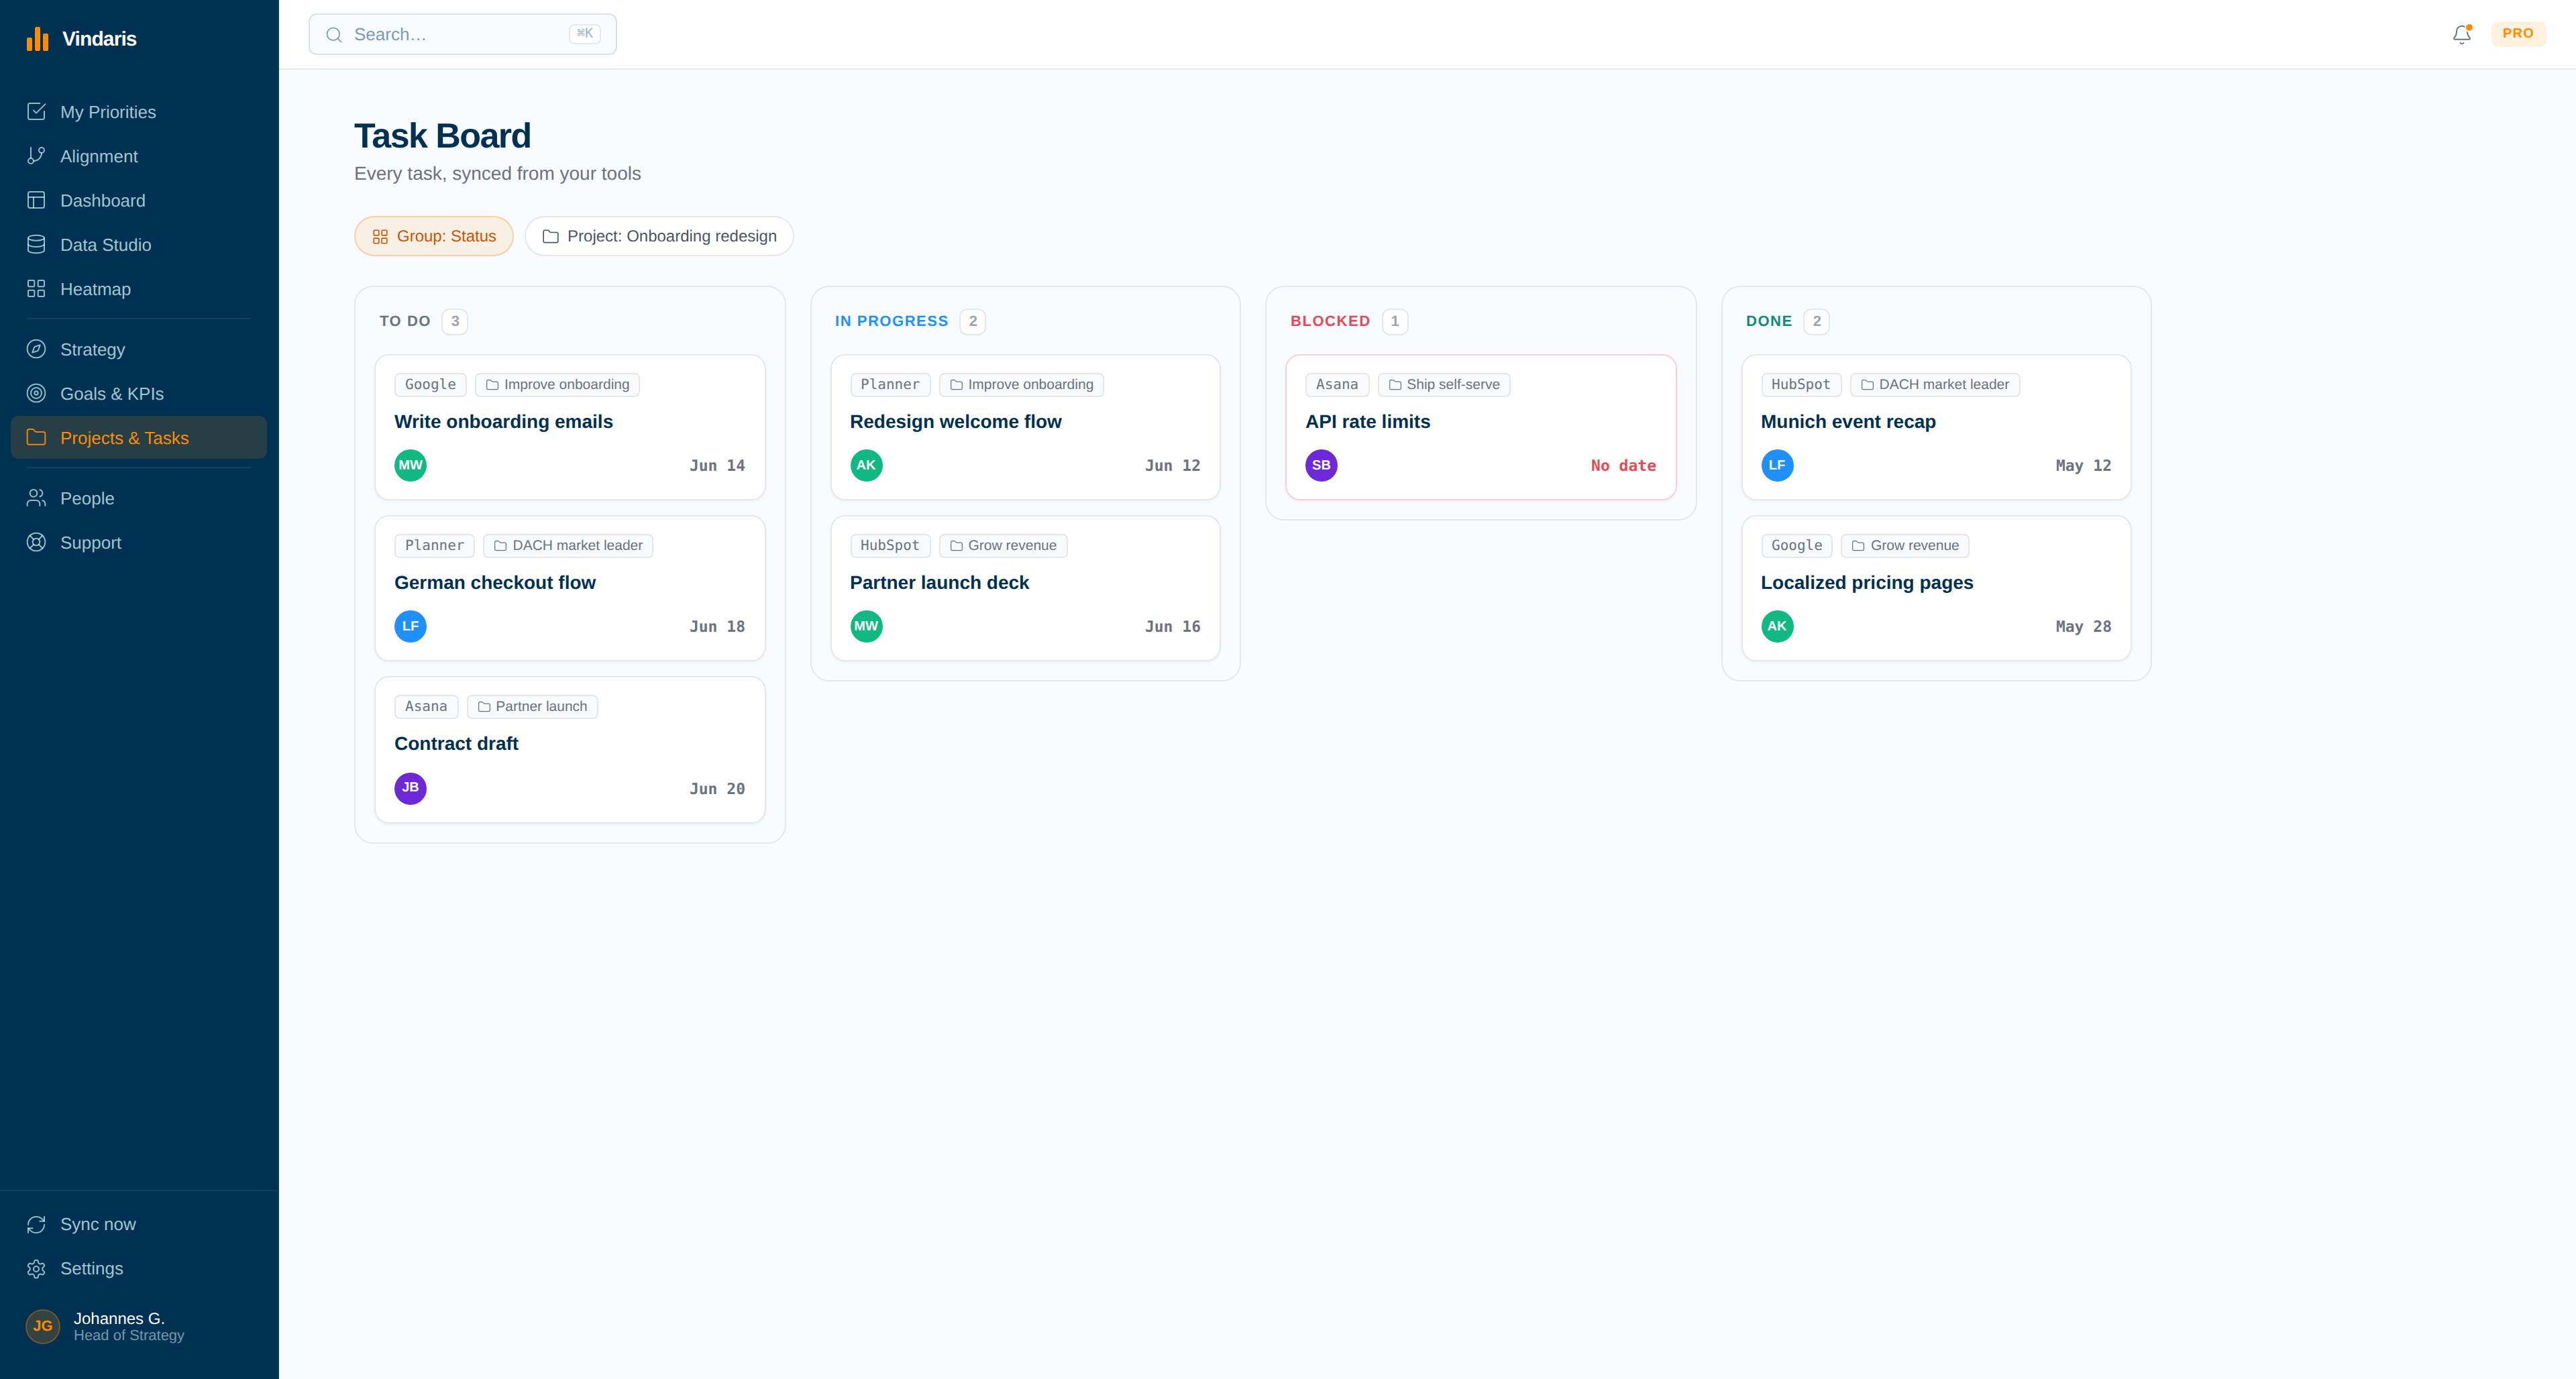
The tasks and projects from your other tools, synced into one board.
A task completed in Jira closes in Vindaris, and a comment written in Vindaris reaches the owner inside the tool they already use. Your teams never leave where the work happens.
Query every goal, KPI, project and task like a database.
Stack-rank teams by progress to plan, list every at-risk KPI with the projects connected to it, or compare planned effort against what actually happened per goal. Build drag-and-drop dashboards, data tables, timelines, org charts and alignment views, and compare any of them week over week or quarter over quarter with Slack context and tasks inline.
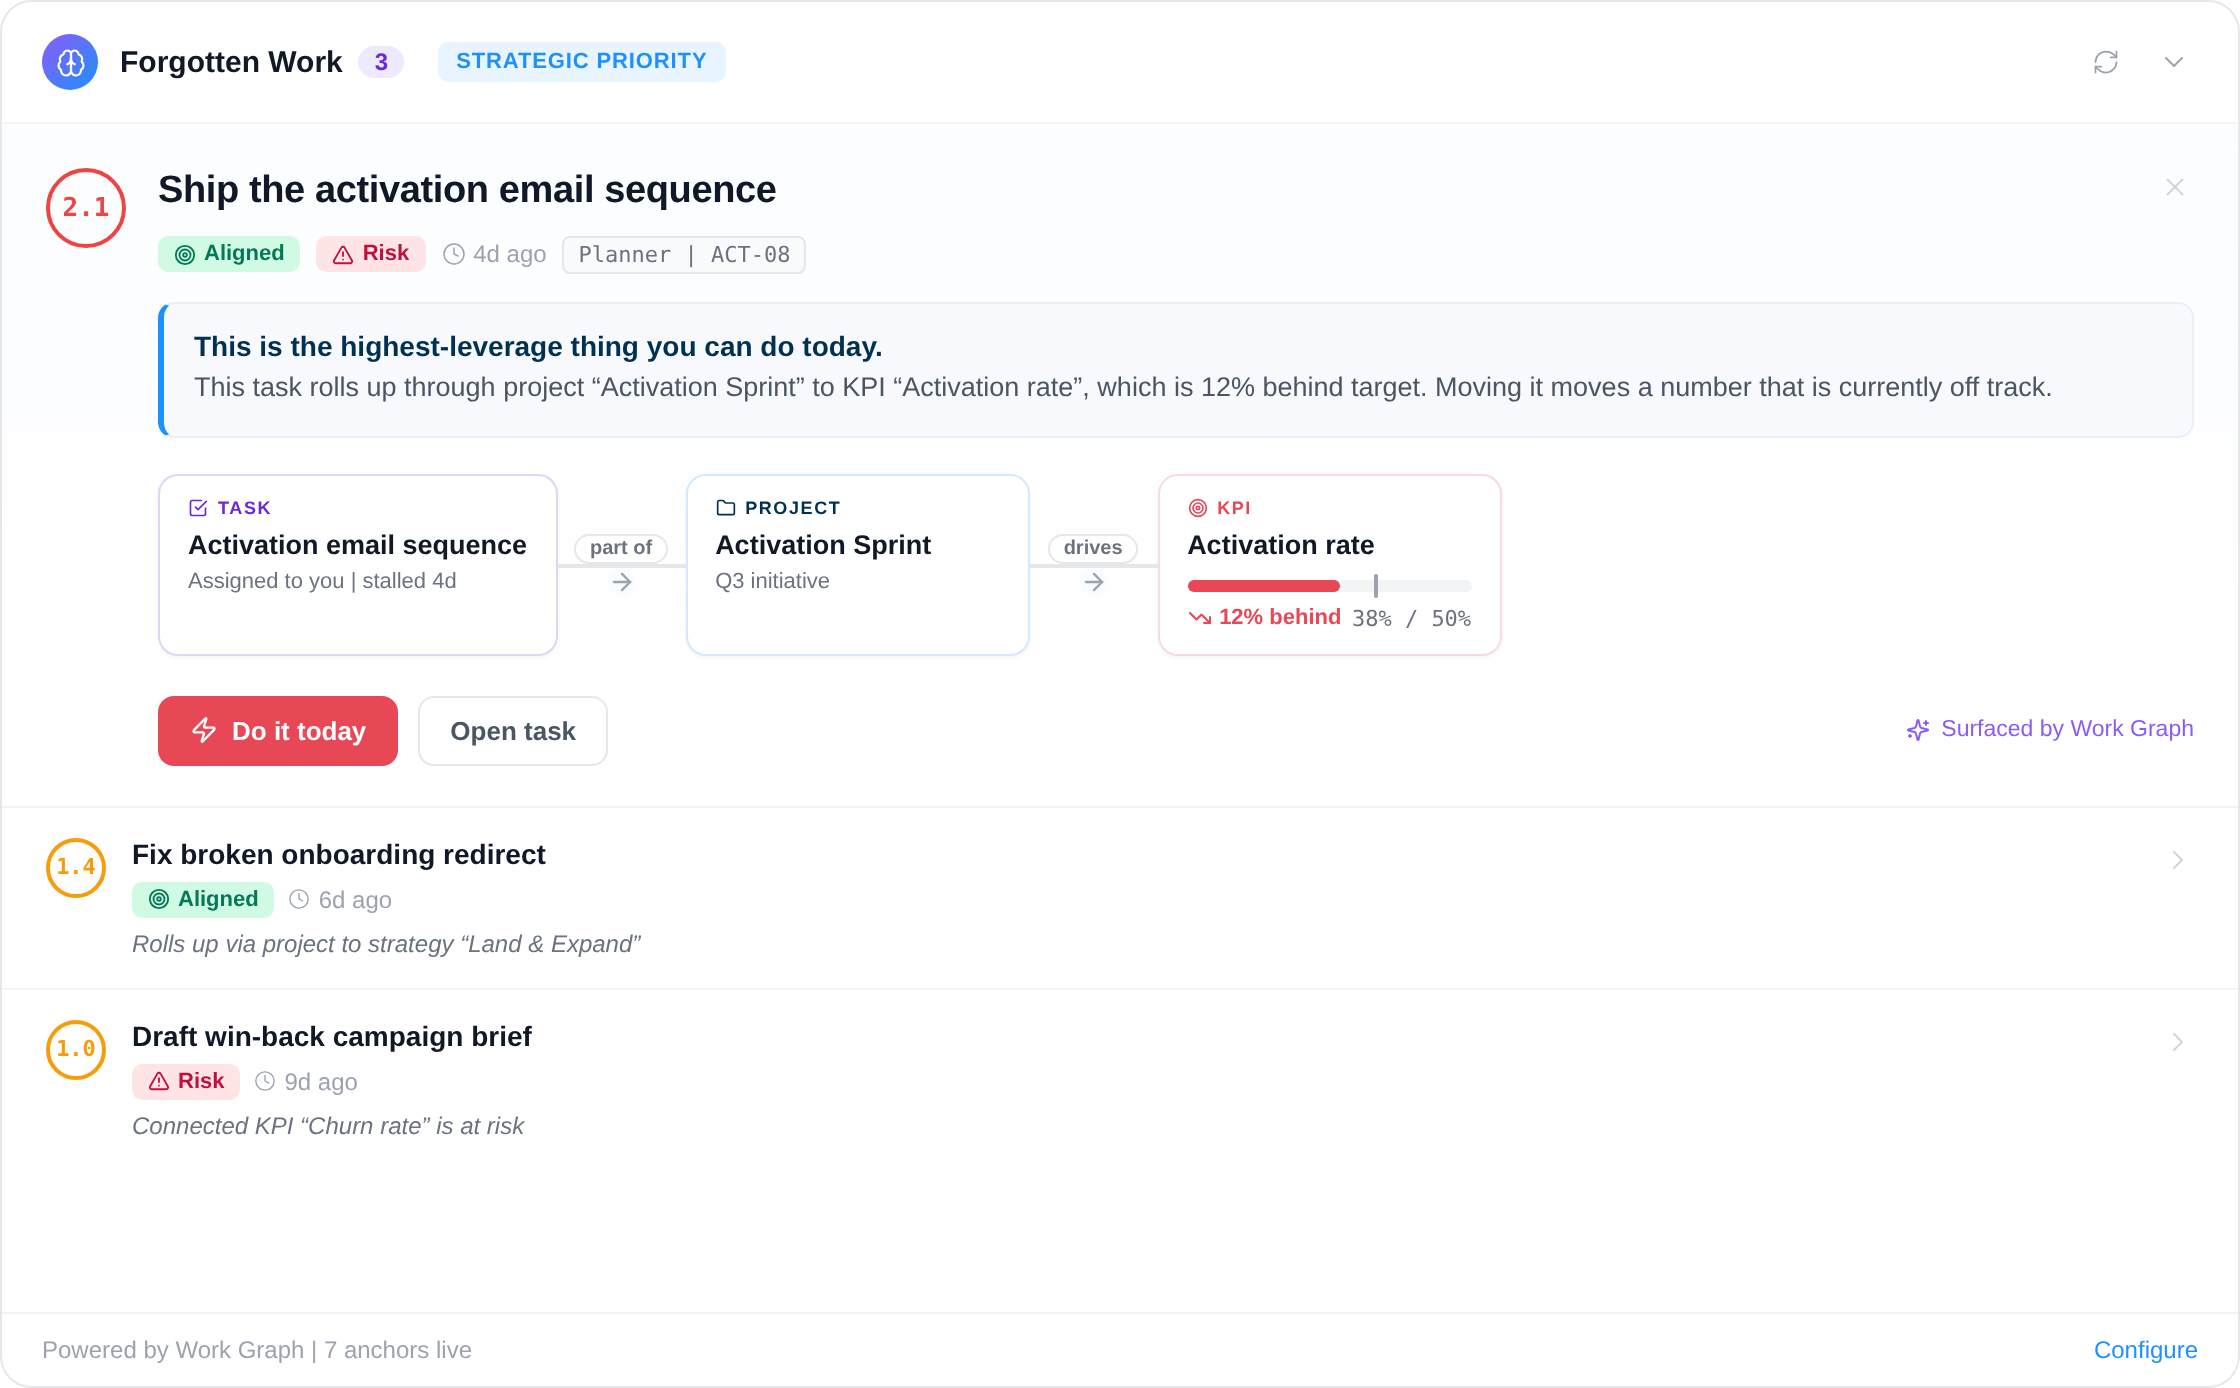
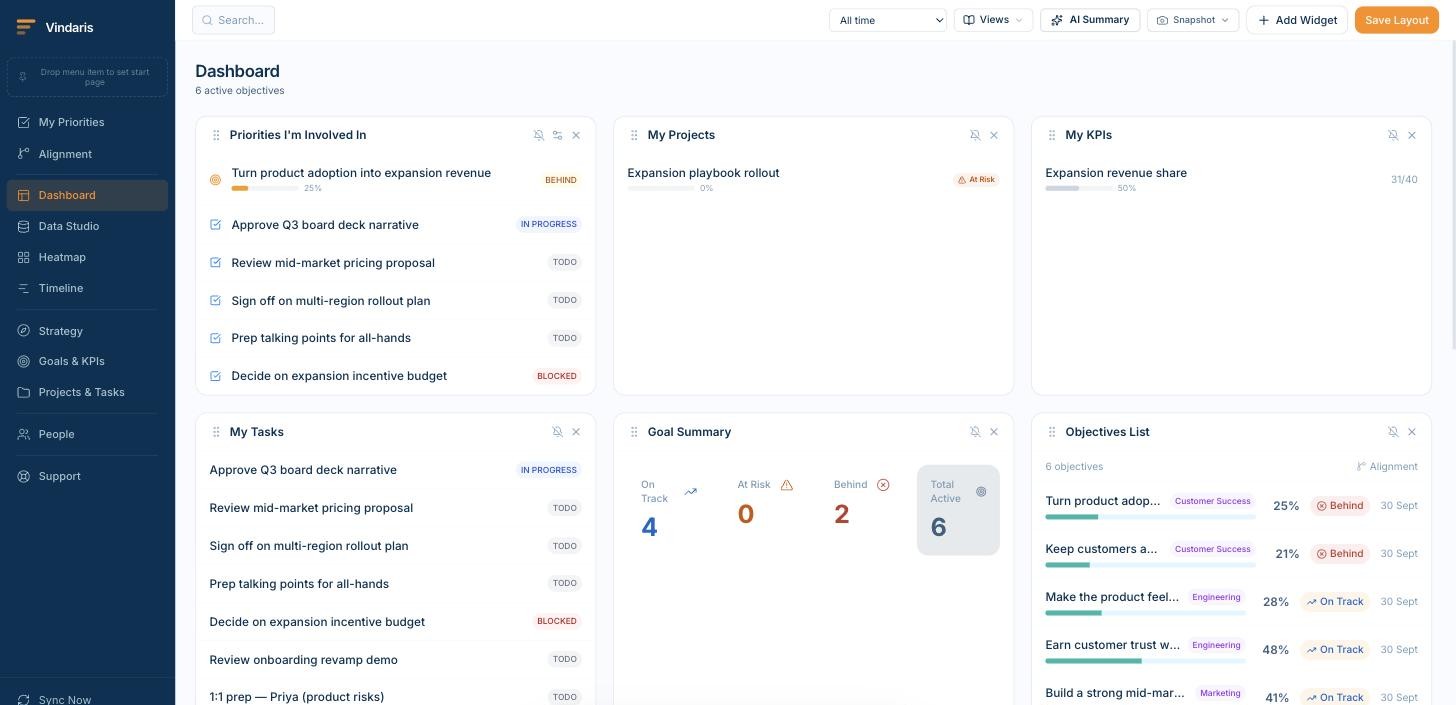
Your priorities, tasks, goals and KPIs on one screen when you open the app.
Drag-and-drop widgets show what you own, what is at risk, and where the quarter stands. Add a Goal Summary, an Objectives List, or an At-Risk Goals panel and the layout saves per user.
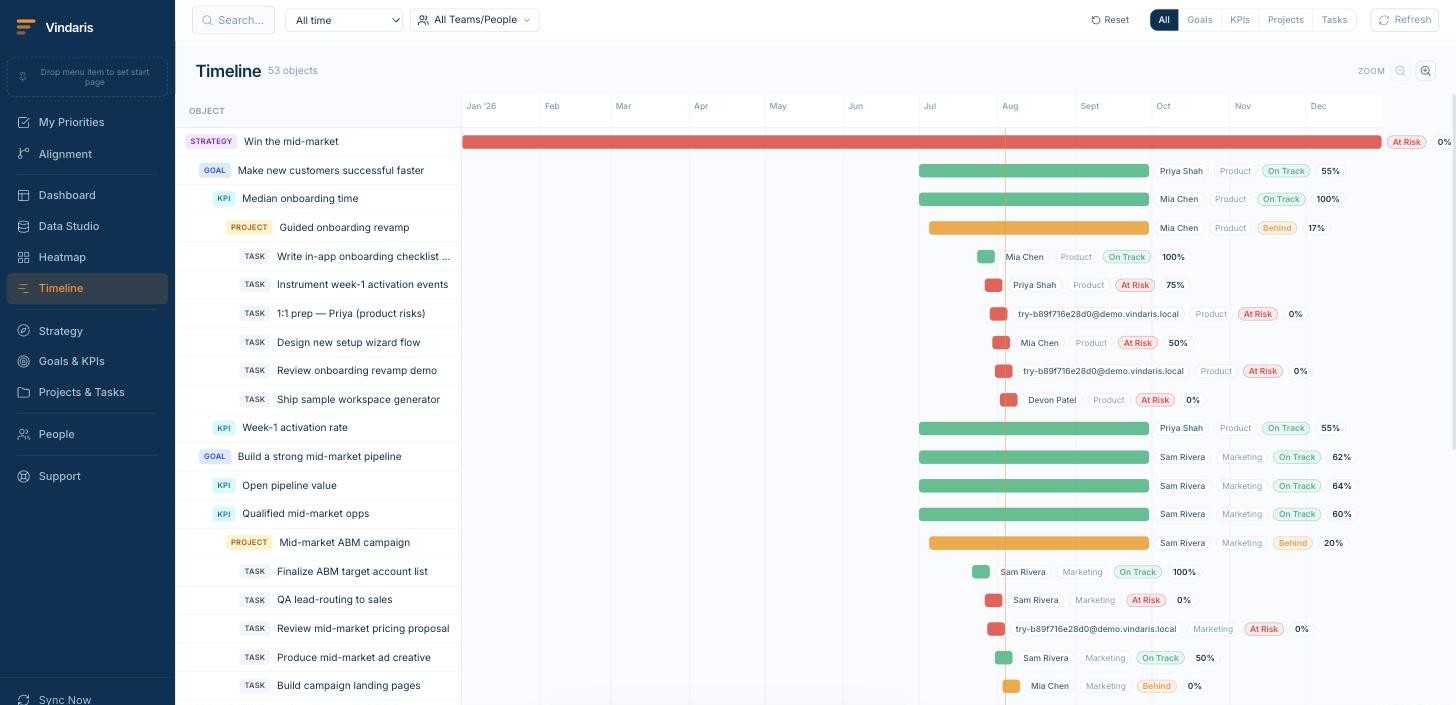
See every strategy, goal, project and task on a single Gantt view.
Bars stretch from start to due date, colour-coded by status. Filter by team, owner or type to spot overlaps and gaps. Scroll the quarter to see who is overloaded and which milestones stack on the same week.
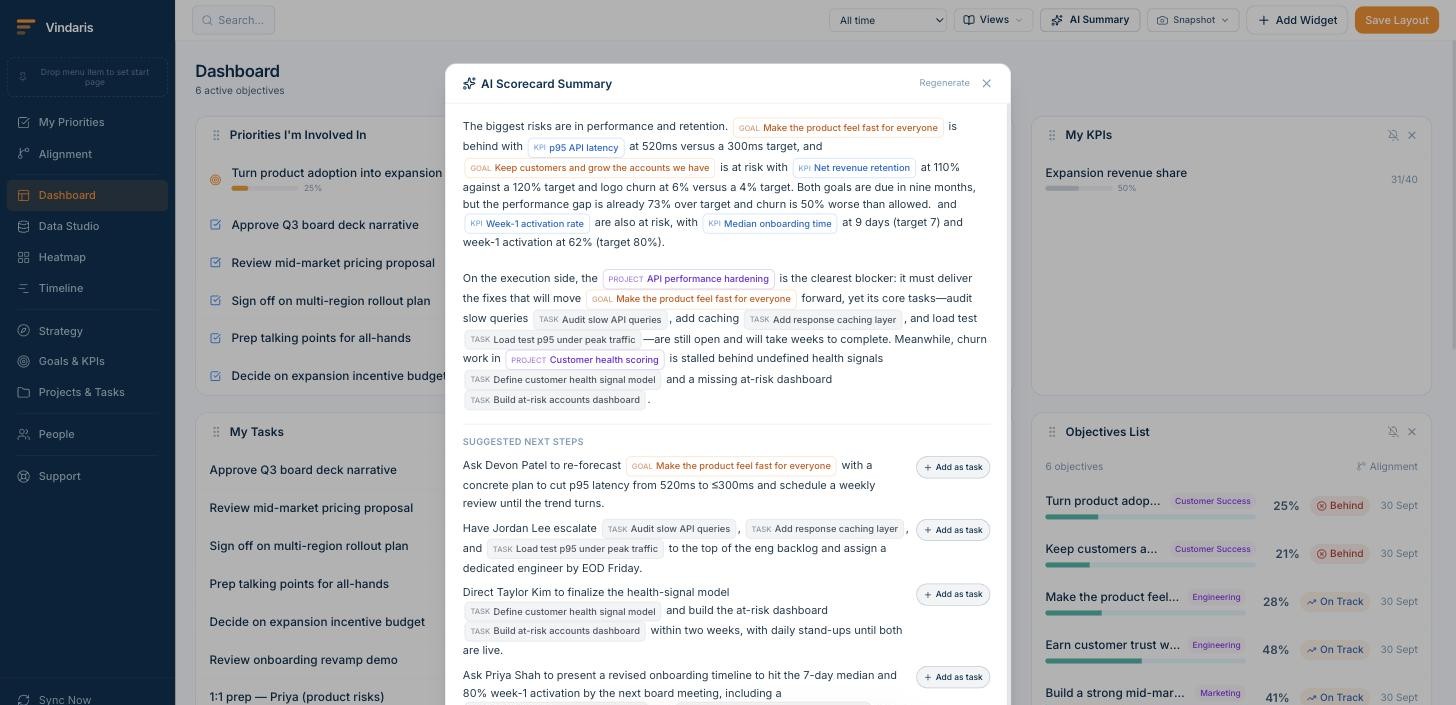
A written read on the quarter, generated from the work, not typed by hand.
The AI Scorecard Summary reads every goal, KPI and project, flags the biggest risks with the connected work that caused them, and writes suggested next steps you can turn into tasks with one click.
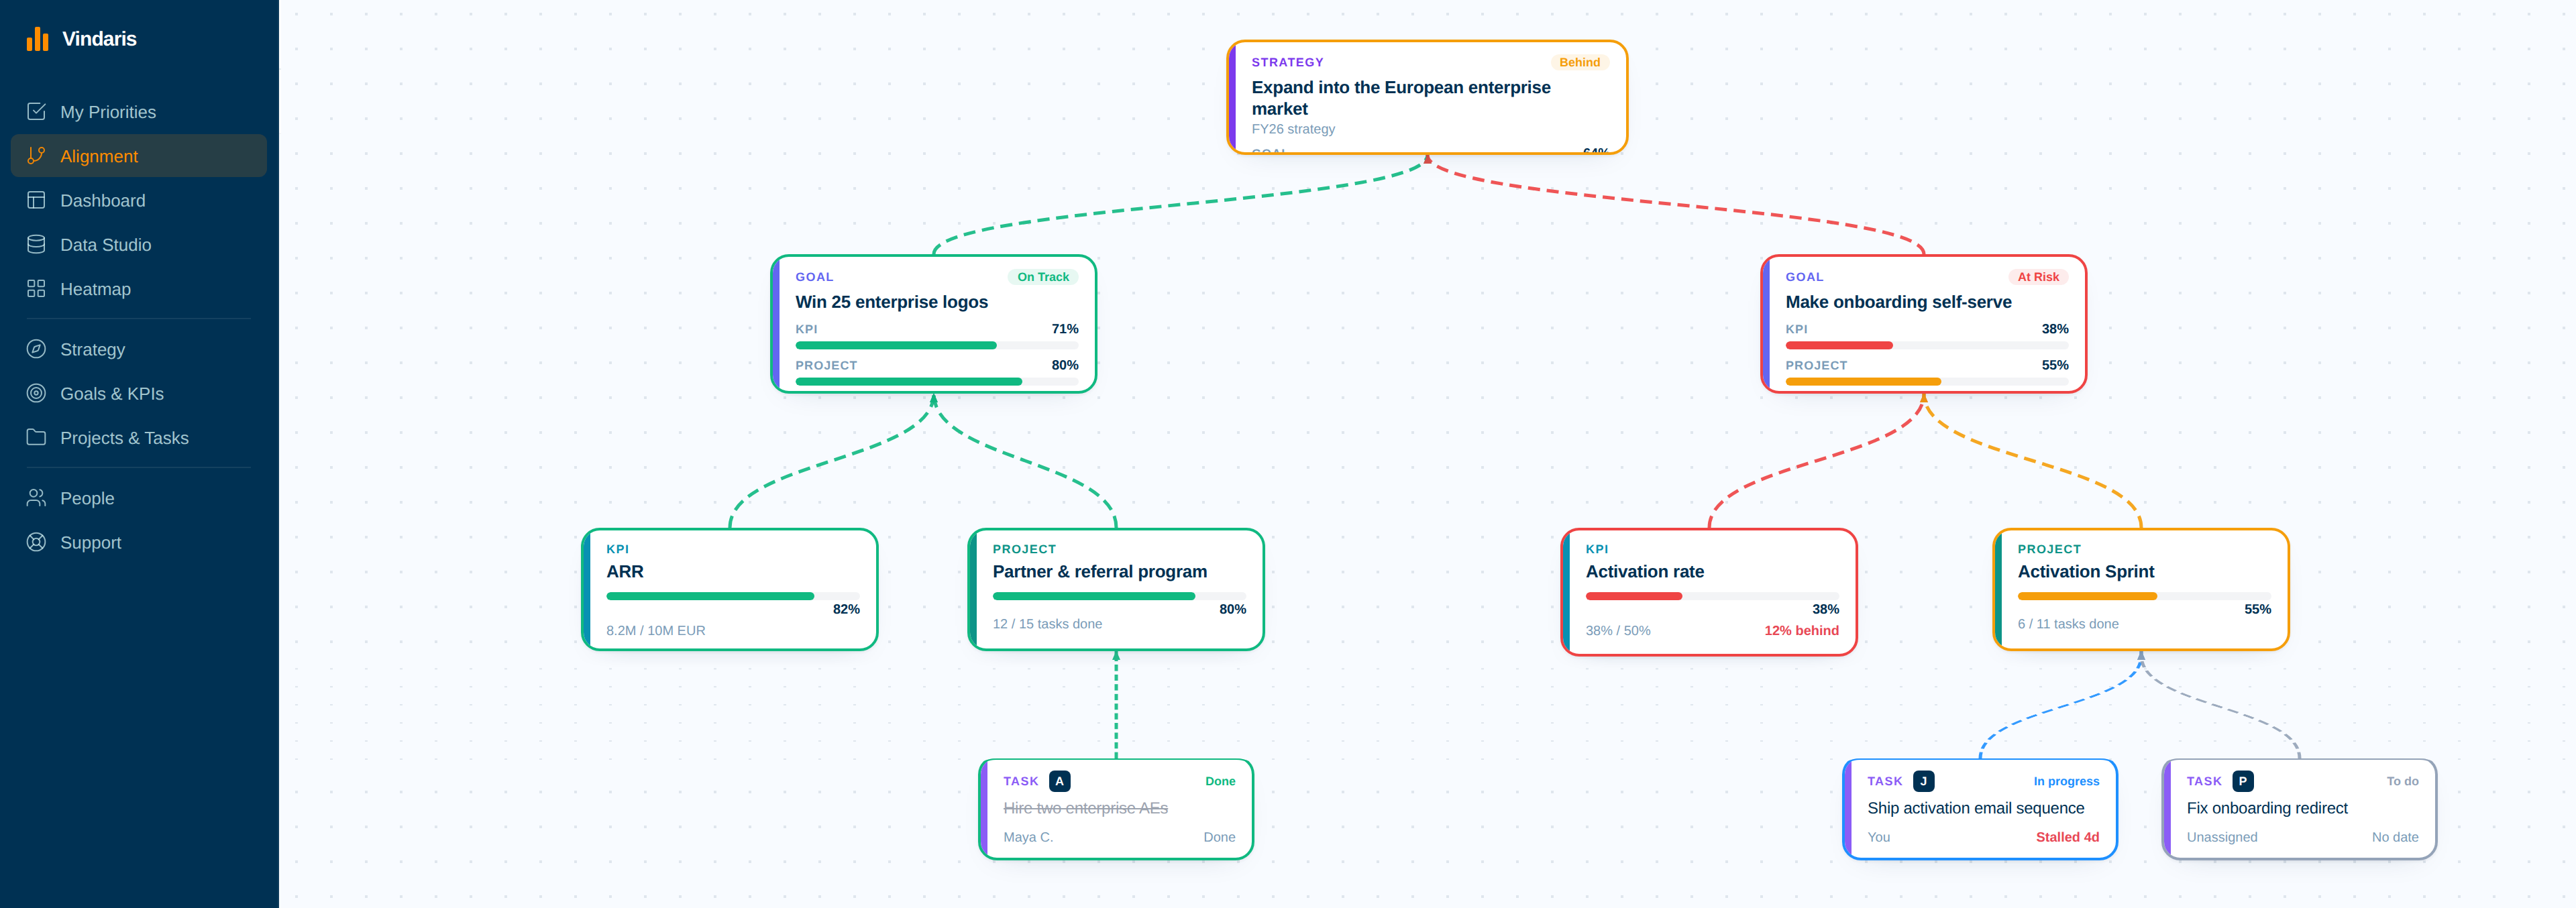
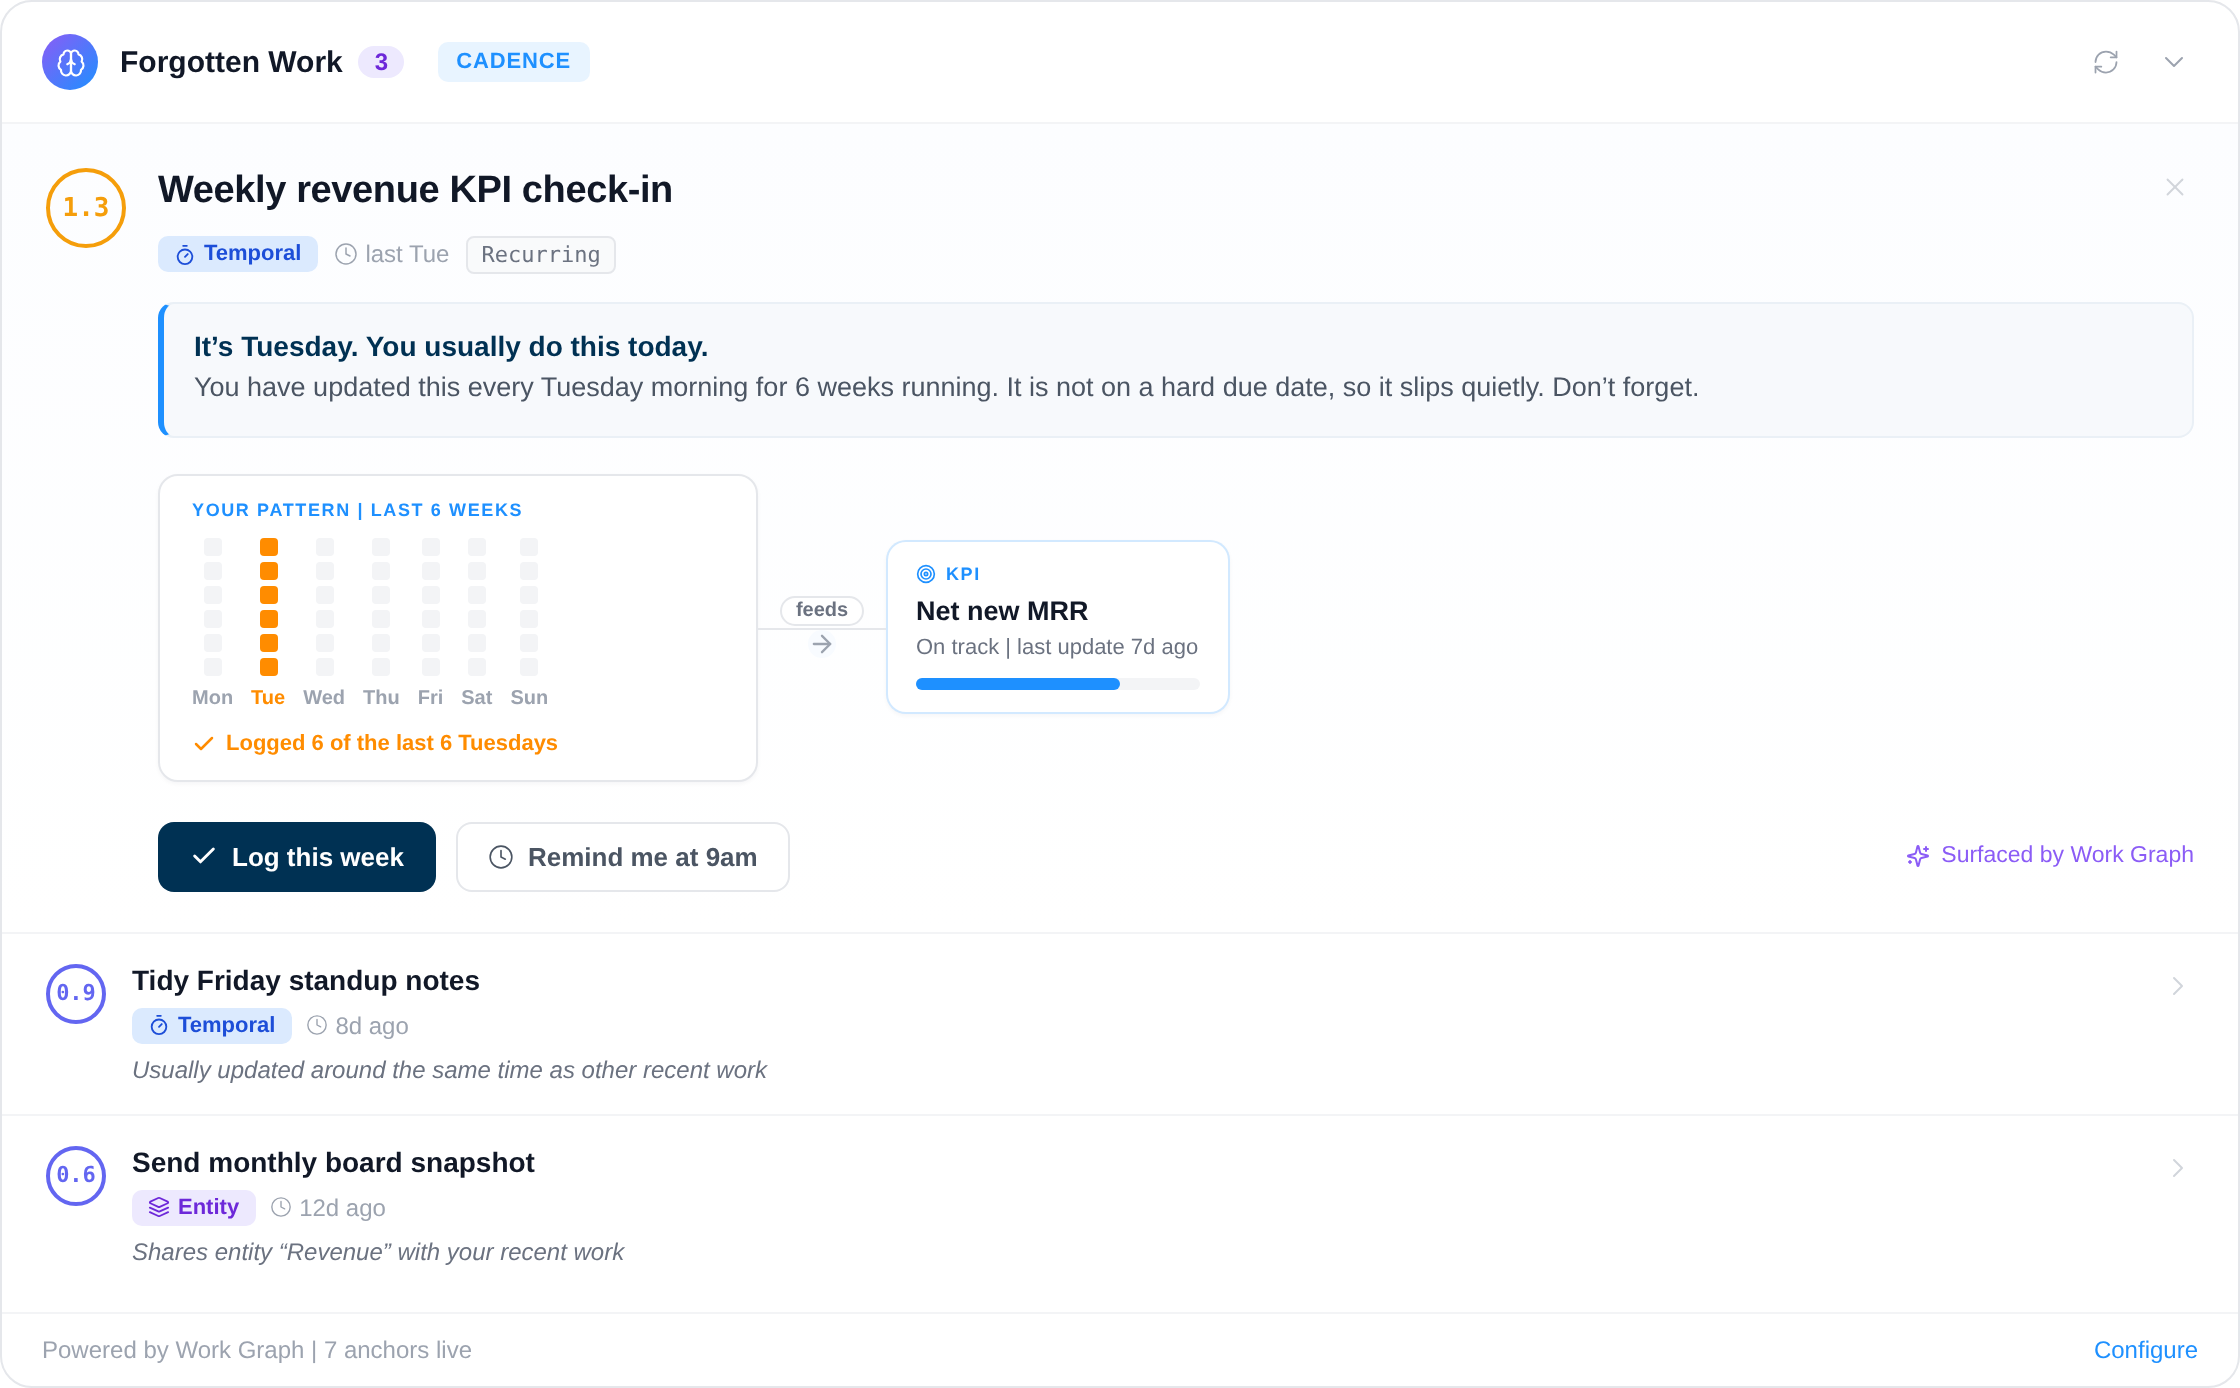
The Work Graph tracks the work behind every goal and alerts the owner.
Vindaris reads the edges between your goals and the tasks beneath them. When connected work slips, a check-in lapses, or a task drifts loose, the owner hears about it with the reason attached, not a status they have to chase.
Bring Vindaris in when the usual tools go quiet.
Work is slipping and no one saw it coming
Connect goals to the work beneath them so a stall surfaces the week it starts, not in the review.
Status reporting eats every Friday
Scheduled summaries write up what changed and deliver it, so the update stops being a manual round.
OKRs stalled after the first quarter
Tie every objective to real, traceable work so check-ins have something to check other than a number.
No one can see the strategy anymore
Draw the whole map on one canvas and let every team find where their work sits inside it.
Business reviews run on stale slides
Open the review on a live heatmap of progress to plan instead of a deck assembled the night before.
See how other teams run it
Every use case, mapped to the view that handles it and the framework it fits.
Switching from another OKR tool? See how Vindaris compares to Weekdone, 15Five, and Tability.
Your framework, your language, your data in Europe.
Runs your framework
Vindaris ships without a prescribed methodology. Rename the levels, nest them the way your operating model nests, and report in the language your company already uses. One workspace can hold OKRs for the product organization alongside EOS Rocks for the leadership team.
Set up in minutes.
Write your strategy narrative
Describe your strategy in plain language and mention the goals, KPIs, projects and tasks it depends on. Vindaris builds the Alignment Canvas from your words.
Connect your tools
Link the systems where work already happens. Synced tasks and projects attach to the goals they serve, and updates flow in both directions.
Let the Work Graph watch
Progress summaries arrive on your schedule. Risk alerts reach the owner the moment connected work starts to slip, with the reason attached.
Write a narrative, get a canvas.
Write your @strategy, @goals, @kpis, @projects and @tasks and automatically map them on the Alignment Canvas in one click.
Free forever, including two integrations.
Start free with full strategy, goal, KPI, task and project management. Pay only when you add more than four people, more integrations, or more automated AI summaries.
Best for individual contributors, small teams or startups. No credit card required.
- All views: Canvas, My Priorities, Heatmap, Data Studio and Task Board
- Two integrations of your choice
- Up to four additional members
- Five ad-hoc AI risk summaries per month
Best for teams, small agencies, or departmental and team management.
- Everything in Free
- All integrations, unlimited sync
- Unlimited AI risk summaries and alignment suggestions
- Up to ten users in one organization
Best for multiple teams, exec teams, Chiefs of Staff or full-org deployments.
- Everything in Connect
- Unlimited users in one organization
- Direct human support, 24h response
- Human-led onboarding
Templates and playbooks you can use today.
Real Excel and PowerPoint files, step-by-step playbooks, and the research behind them. No email gate. Take them even if you never sign up.
Your canvas is one paragraph away.
Describe your strategy, connect your tools, and let the Work Graph keep watch. Setup takes minutes.
Create my strategy canvasFree forever | No credit card required