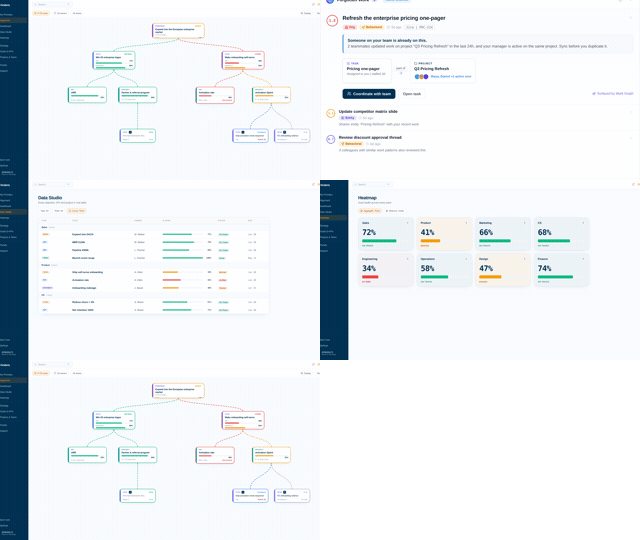
Own whether the strategy lands, with the graph to prove it is moving.
You need to see where effort should shift, spot risk before it compounds, and turn insight into new initiatives. Vindaris gives you the alignment graph, the heatmaps and the alerts to do it from real work.
Where strategy actually moves, moment by moment.
Strategy rarely slips in the quarterly review. It slips in the gaps between them. Vindaris shows up in each one and keeps the map current.
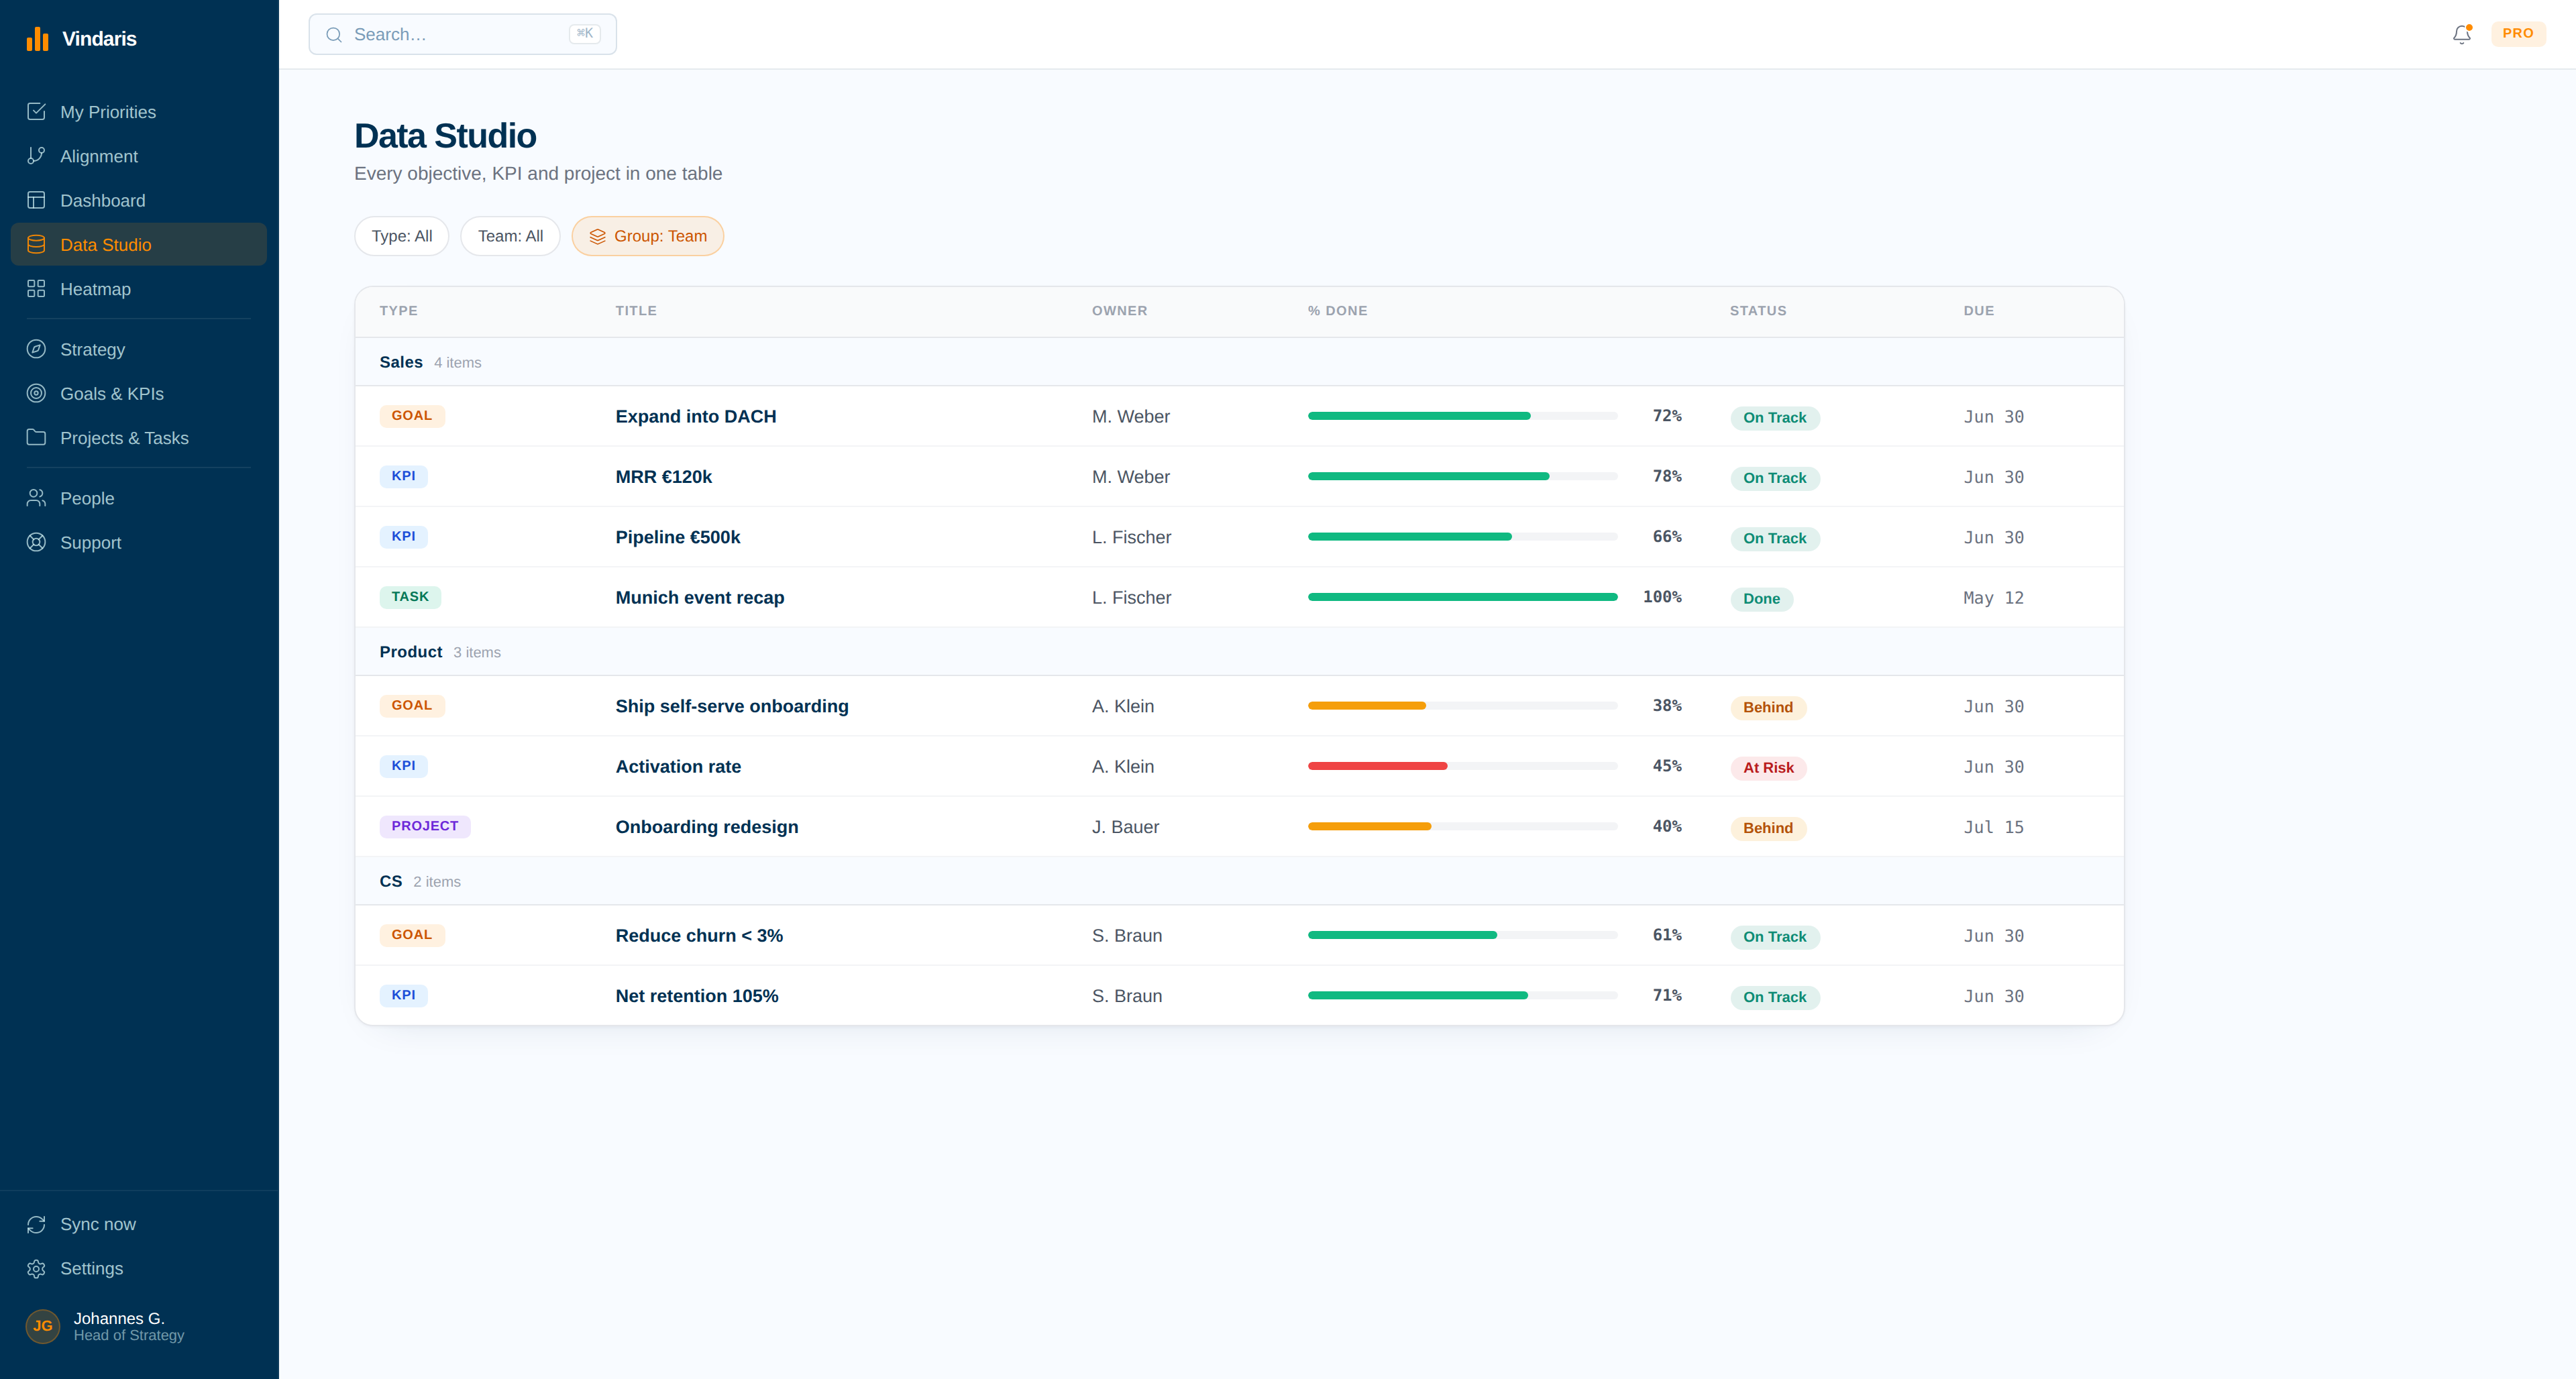
The strategy and the work that delivers it, in one graph.
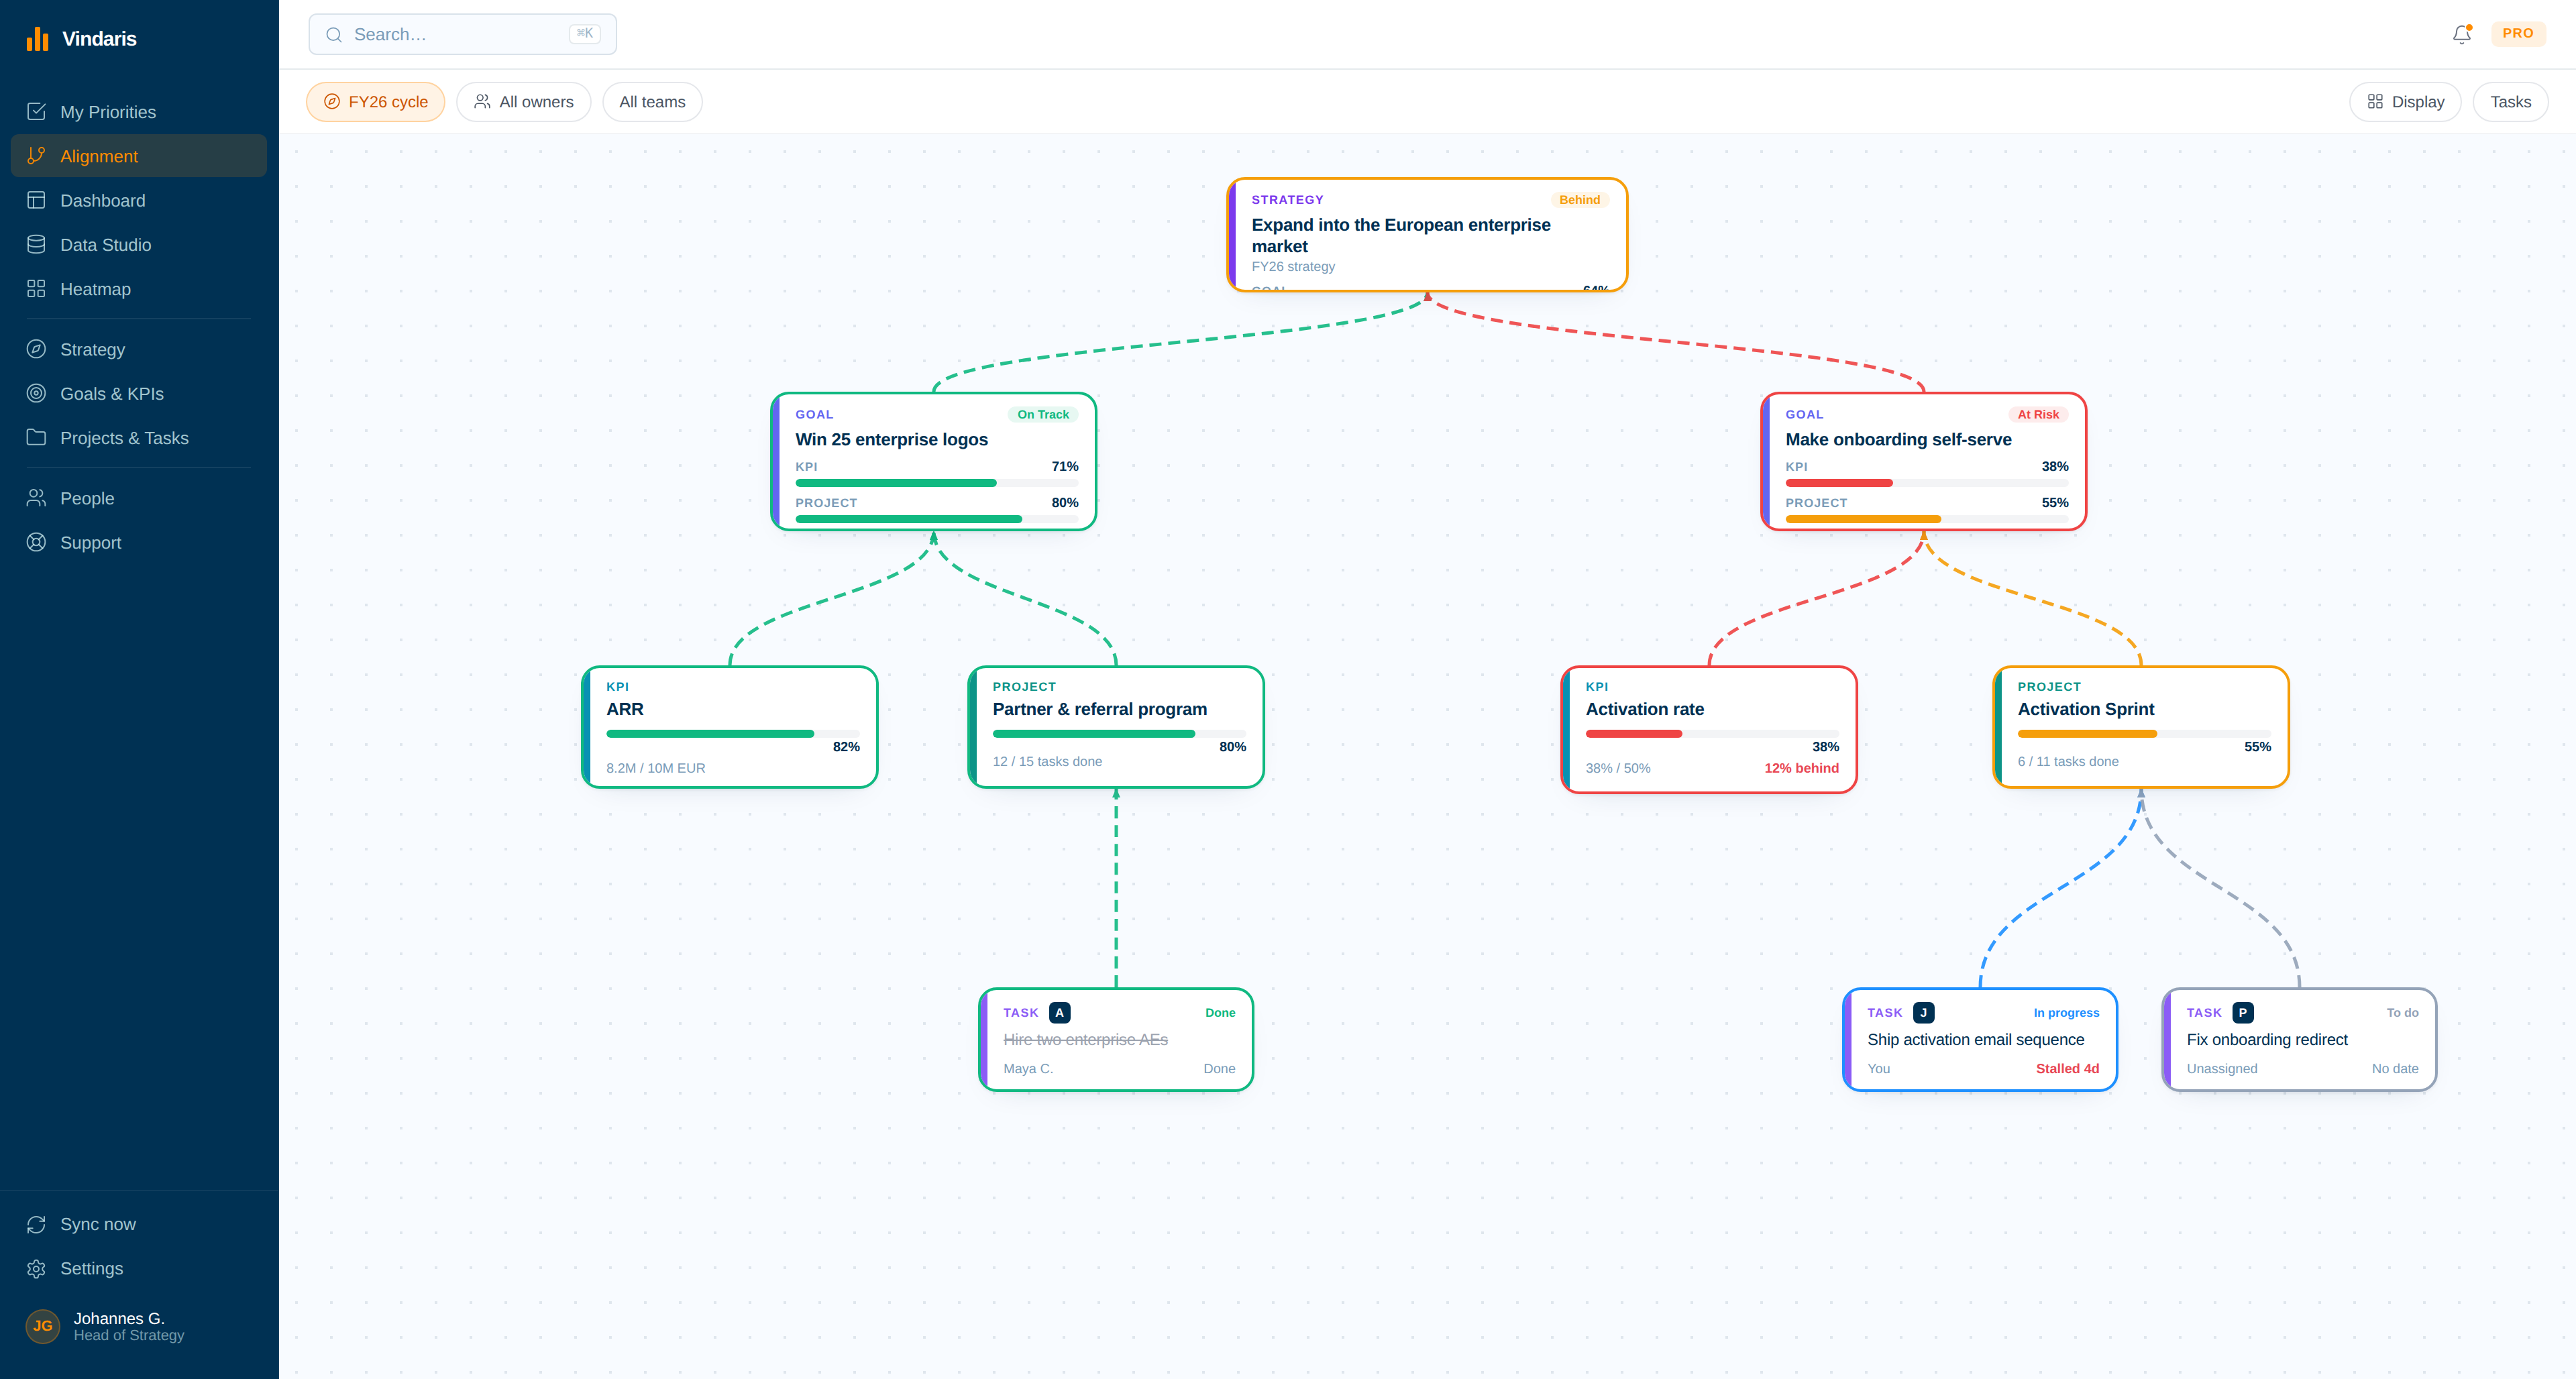
Strategy that lives in a deck cannot tell you where it is failing. Vindaris connects every objective to the work moving it, so you can see where effort is misallocated, where risk is building, and where a new initiative needs to exist.
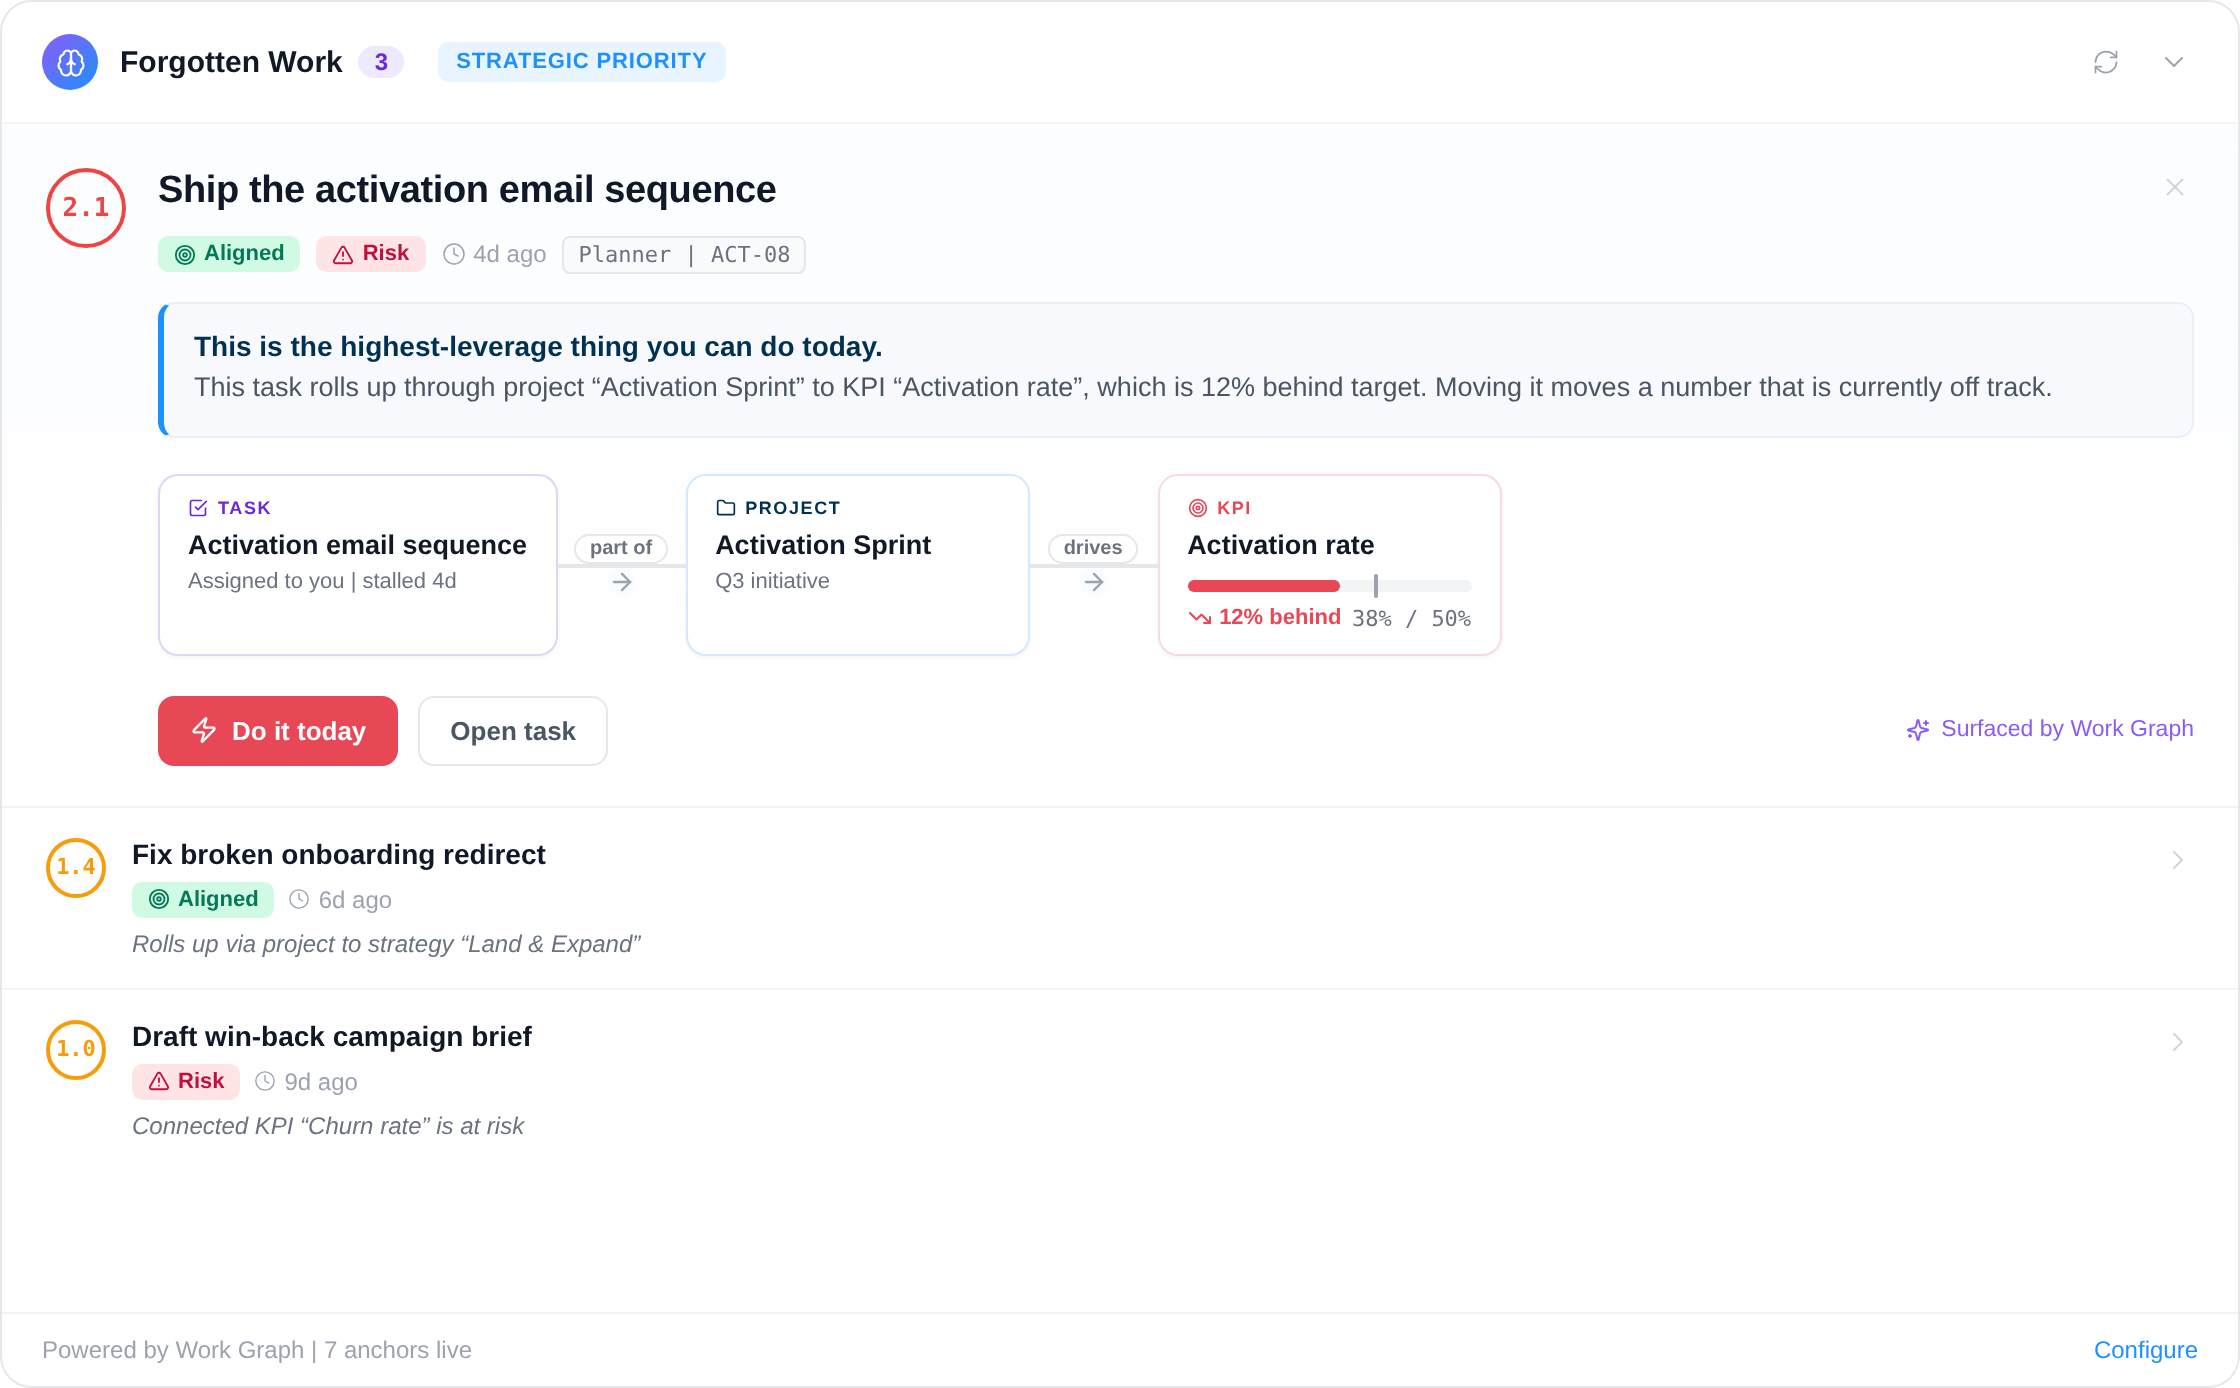
Get alerted when the work behind a strategic objective stalls, early enough to act rather than explain after the quarter closes.
See where effort is concentrated and where priority bets are starved, so you can reallocate capacity toward the strategy that matters.
When a goal has no real work behind it, the graph shows it. That gap is where a new initiative should be proposed or a team brought in to collaborate.
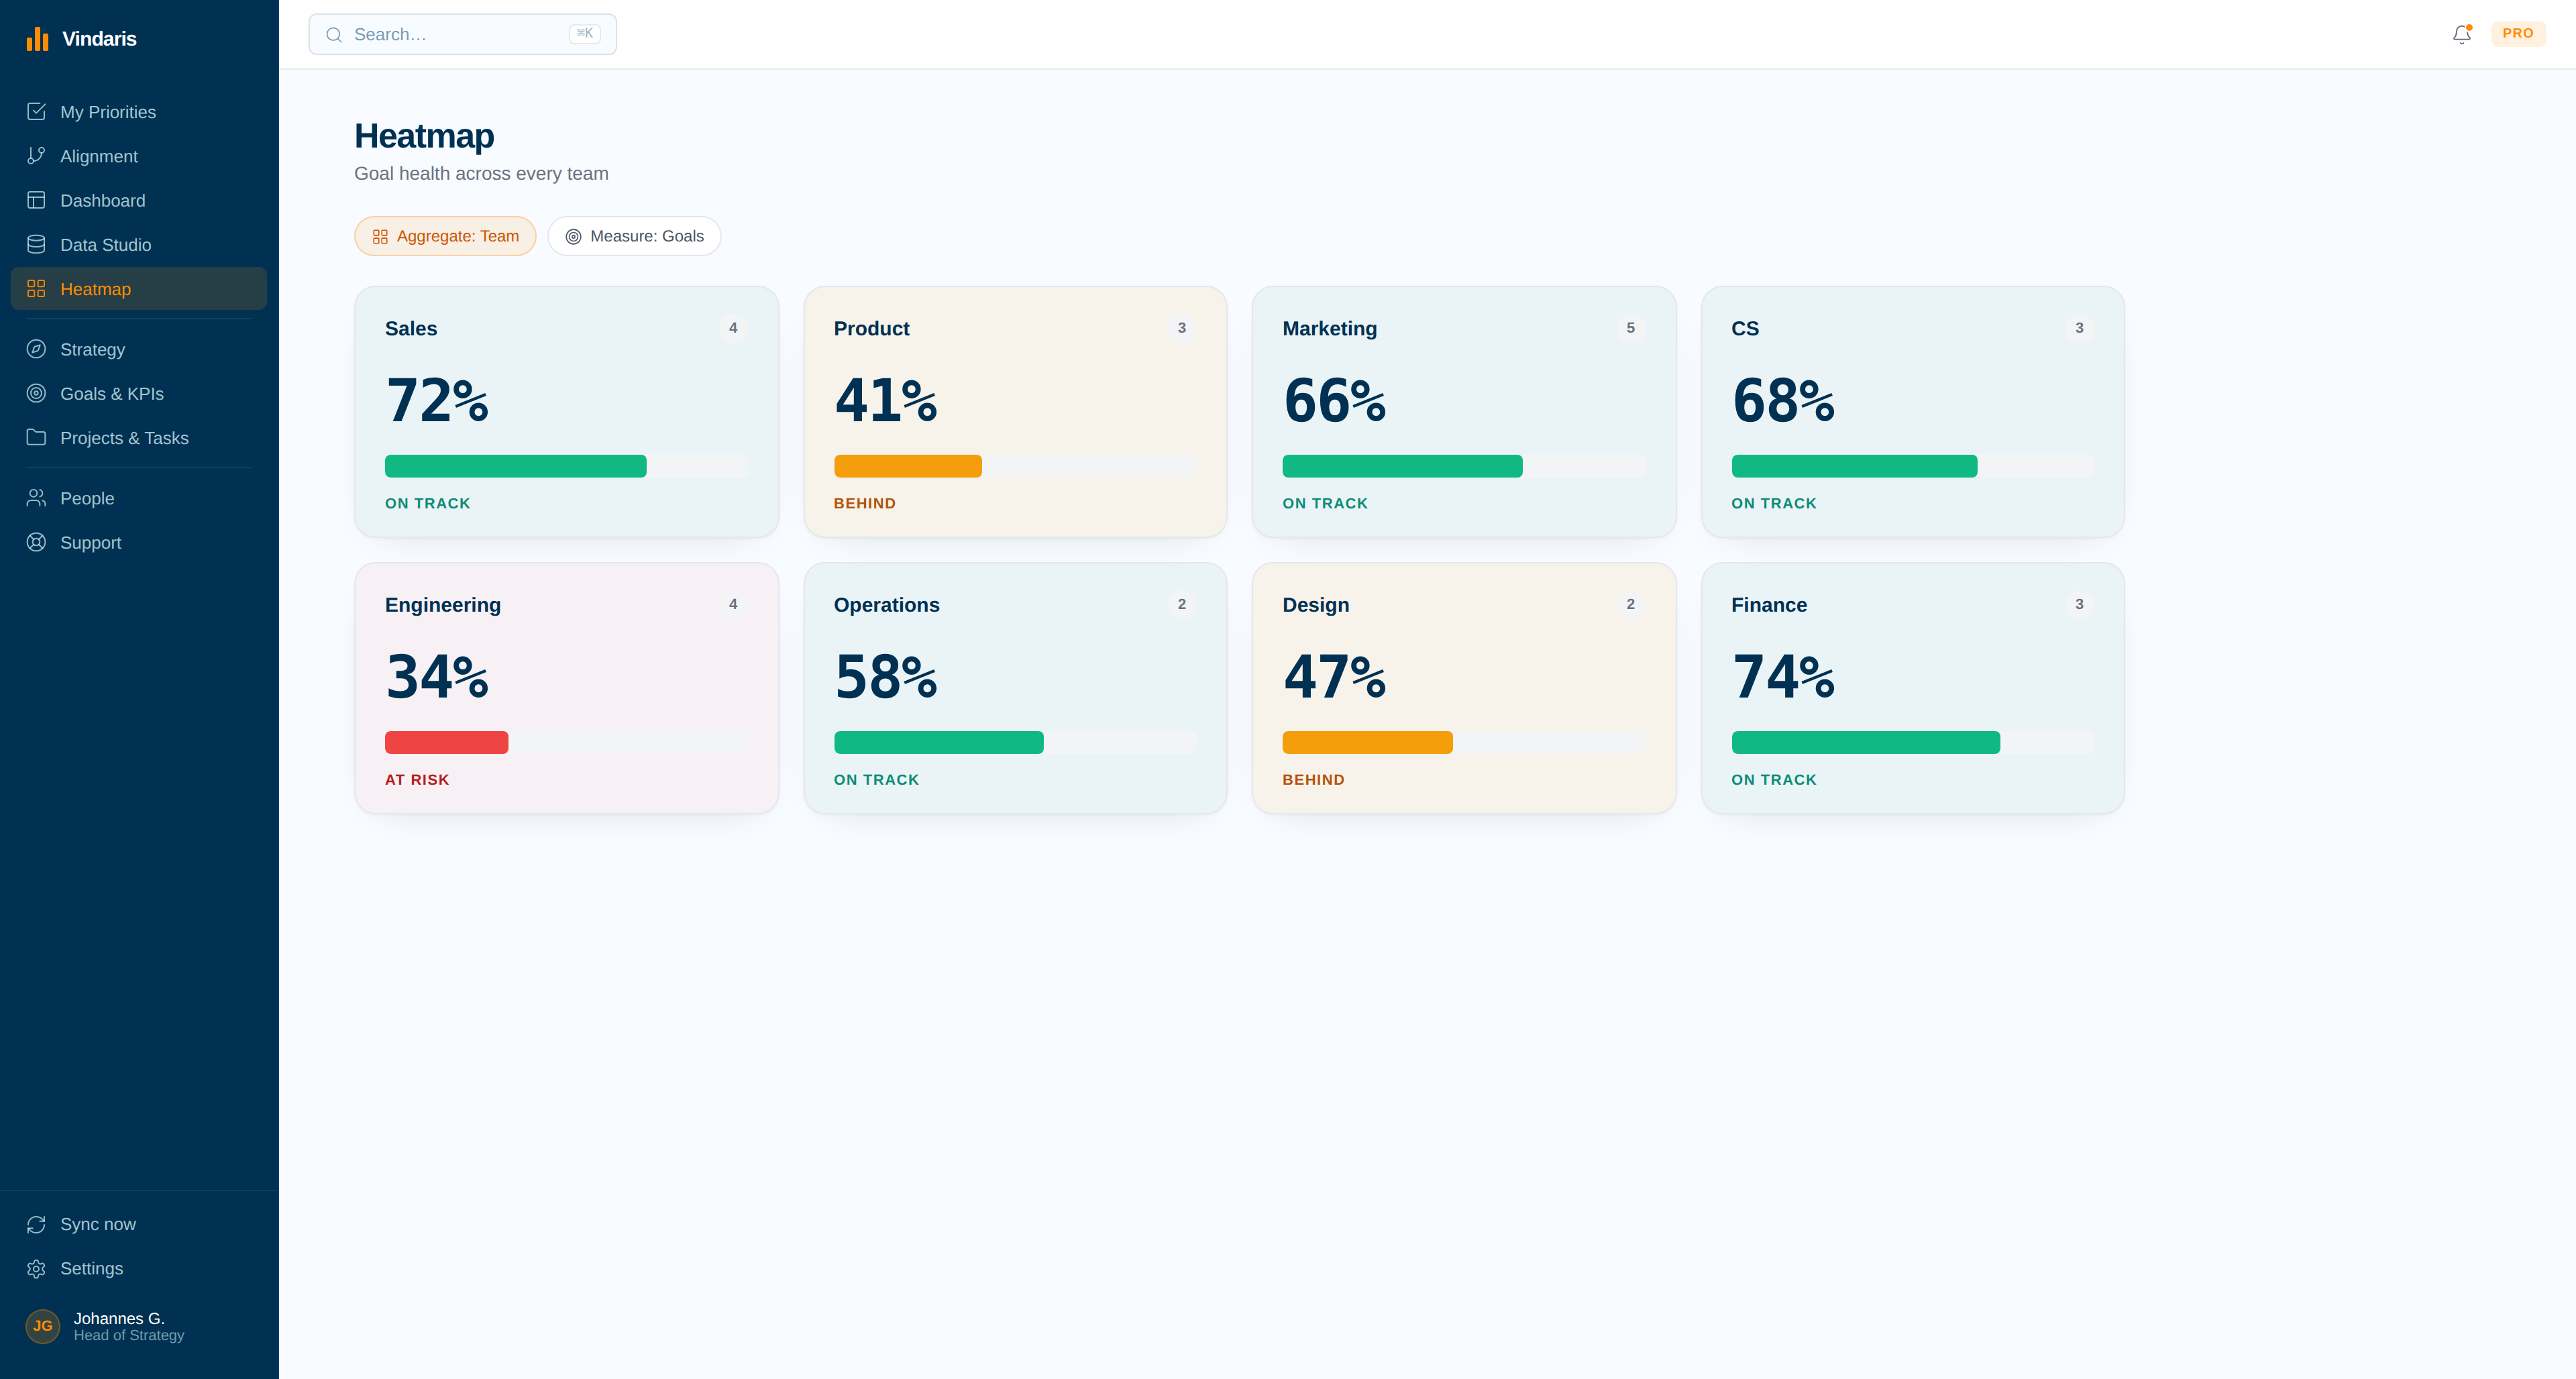
Run heatmaps across teams and initiatives to see what is starting to slip while there is still time to intervene.
Keep a live read across every team at once, so you are never relying on one function's version of how the strategy is going.
Turn a decision into action in the same system. Spin up a new initiative, attach the tasks, and assign owners without leaving the strategy view.
Five days of steering the strategy.
A Chief Strategy Officer spends the week moving effort toward the bets that matter and away from the ones that do not. Here is how that runs on Vindaris.
Open the risk alerts
The week starts with alerts on the objectives whose work has stalled. You triage which ones threaten the strategy and which can wait, before the day fills up.
Read the alignment graph
The graph shows a priority bet starved of effort while a lower-priority one absorbs three teams. You line up the reallocation conversation with the picture to back it.
Propose a new initiative
A strategic goal has no real work beneath it. You create the initiative directly in Vindaris, attach the first tasks, and name an owner, so the gap closes instead of lingering.
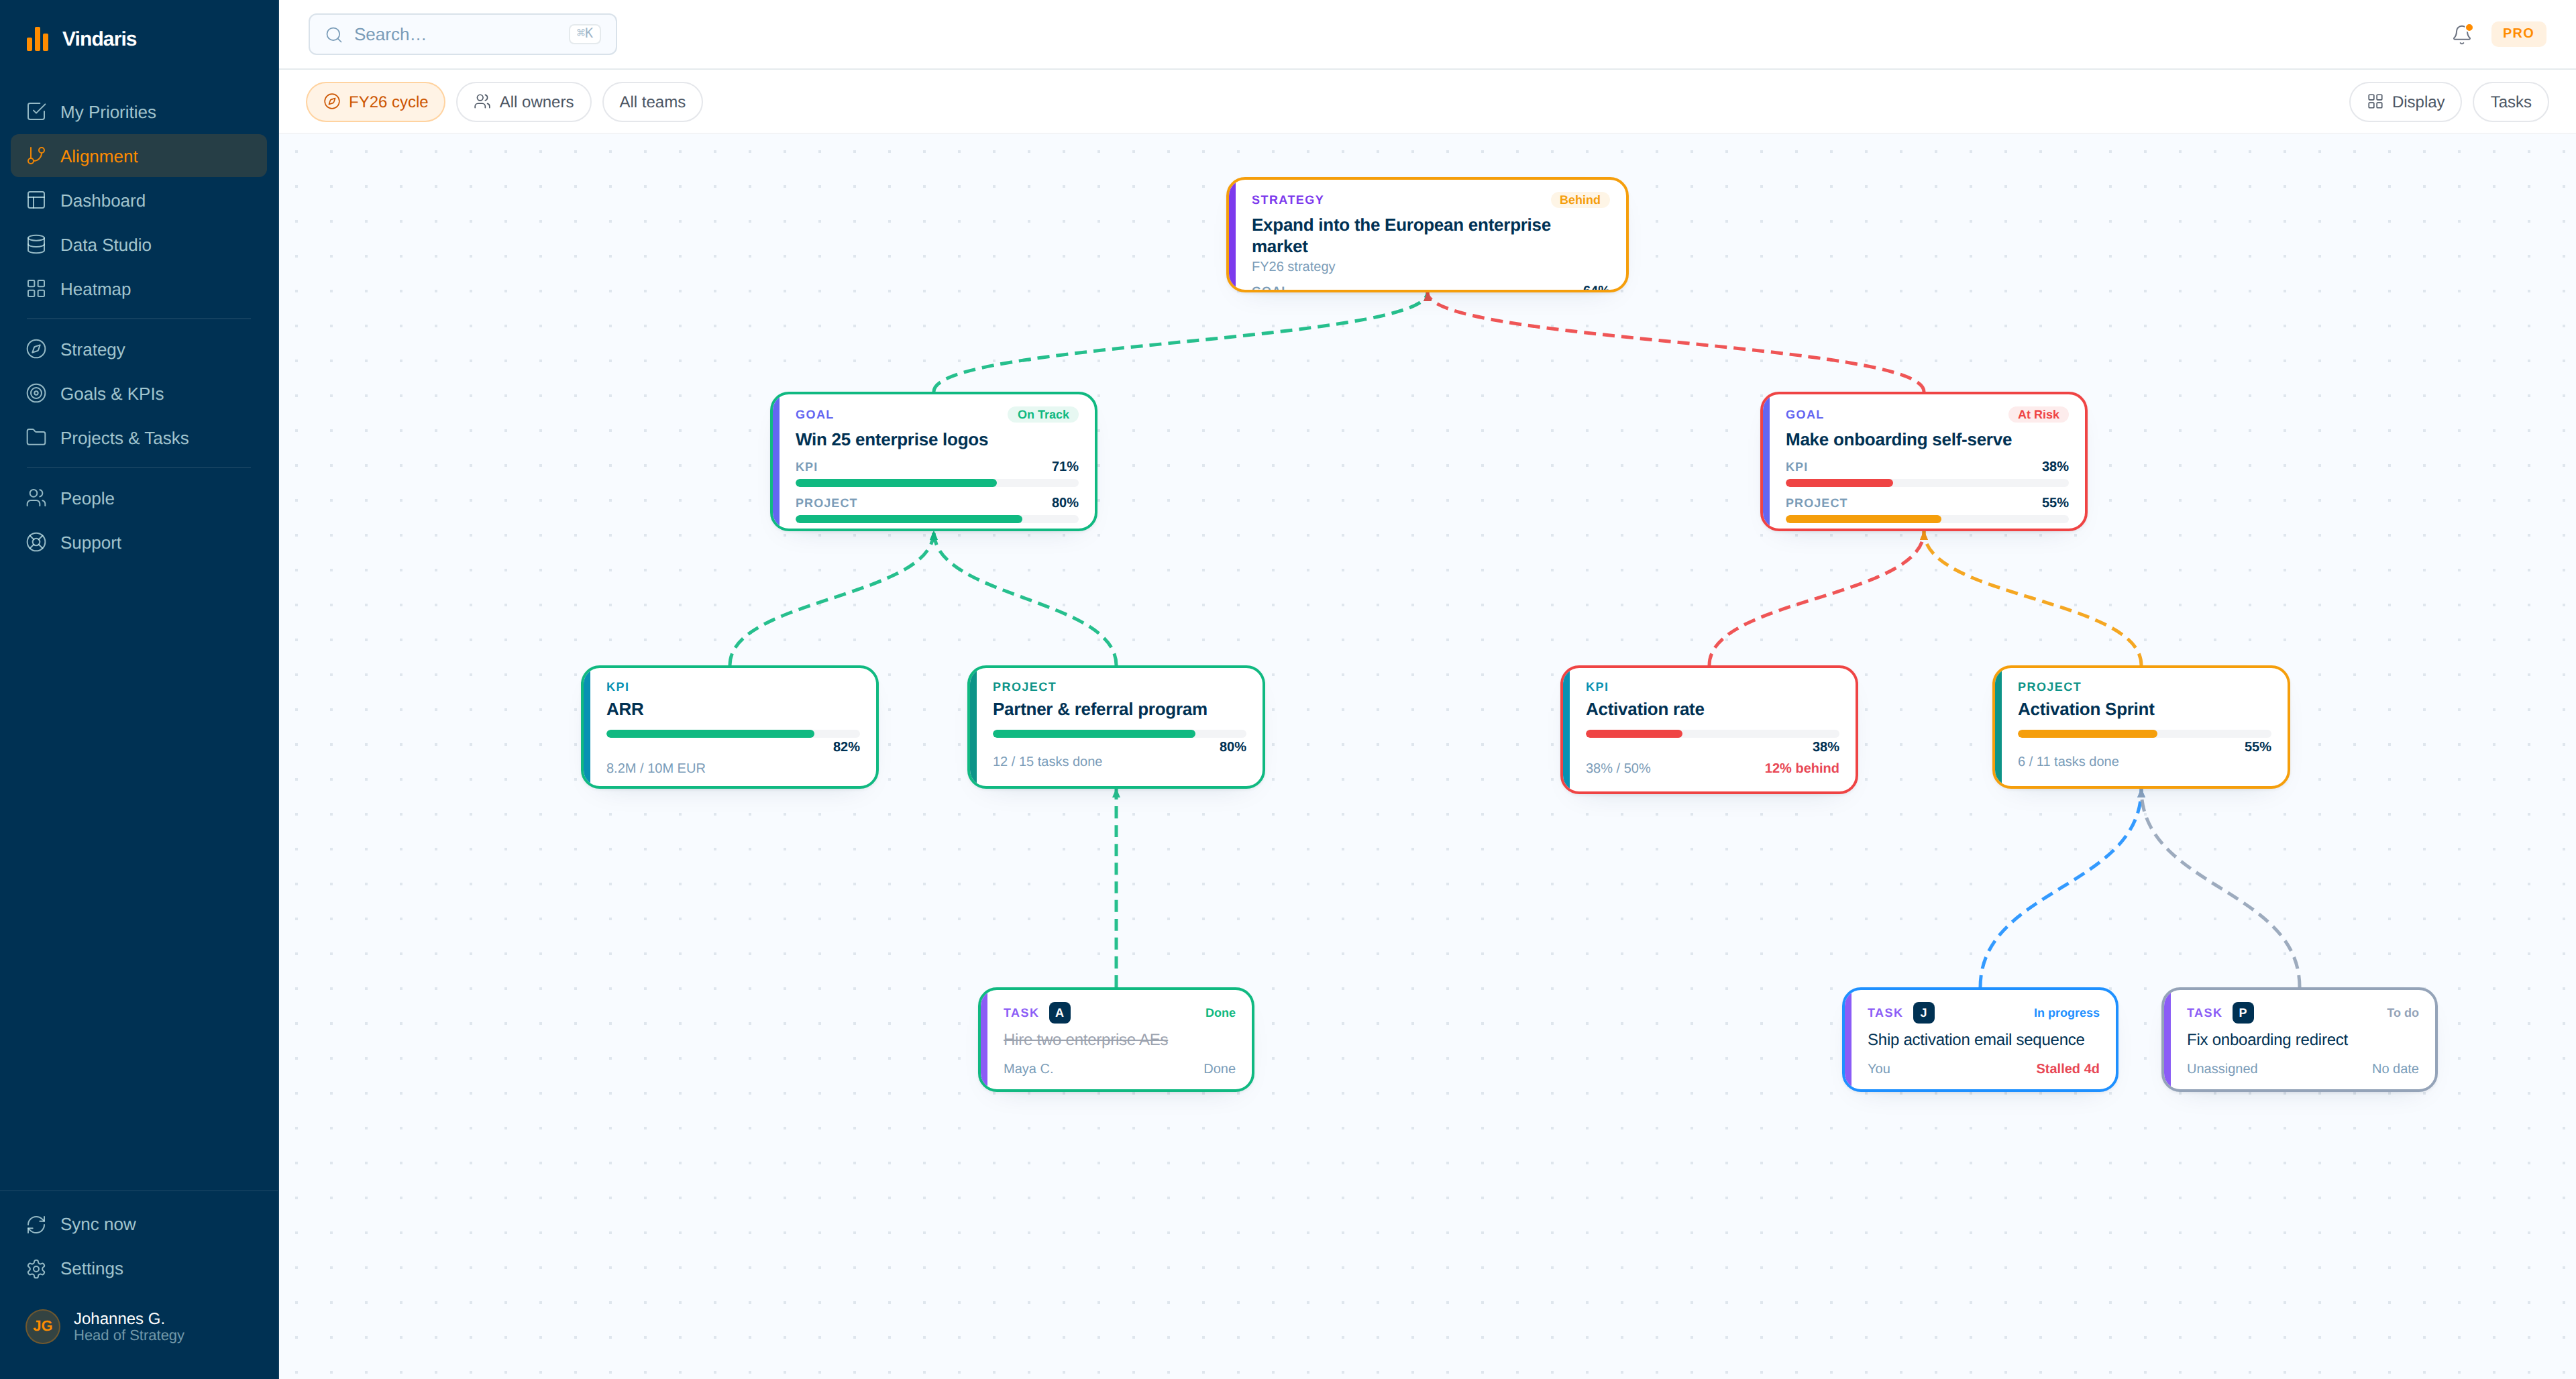
Scan the heatmaps
Heatmaps across teams flag two areas starting to slip. You reach out to unblock one and bring a second team in to collaborate before either turns into a missed target.
Review the multi-team dashboard
One dashboard gives you the read across every team. You close the week knowing where the strategy is moving and where next week's attention has to go.
Strategy you can steer, not just present.
A Chief Strategy Officer is judged on whether the strategy lands, but most of the stack only lets you describe it. The plan sits in a deck. The work happens in tools you cannot see into. By the time a bet is visibly failing, the effort was misallocated months ago and the window to reallocate has closed. Insight arrives too late to act on.
Vindaris connects the strategy to the work delivering it. The alignment graph shows where effort is concentrated and where priorities are starved, heatmaps and risk alerts surface slipping bets early, and dashboards give a live read across every team. When the graph reveals a gap, you create the initiative and tasks to fill it without leaving the view. You spend the week reshaping the strategy as reality moves, not narrating where it already went wrong.
See a bet drift while there is still time to move it.
Twelve deterministic and AI-driven alerts watch the work under every strategic pillar. The moment progress rolled up from real work falls behind the plan on the page, the alert lands on the owner with the cause attached, not in a quarterly review three weeks too late.
Free forever, including two integrations
Start free with full strategy and strategy management. Add two integrations to sync tasks. Pay only when you add more than 4 people, need more integrations, or more AI summaries.
Best for individual contributors, small teams or startups. No credit card required.
- All features (incl. Alignment Canvas, My Priorities, Heatmap, Data Studio & Task Board)
- Set up 2 integrations of your choice
- Invite up to 4 additional members
- 5 ad-hoc AI risk summaries per month
Best for teams, small agencies, or departmental and team management.
- All in Free
- All integrations, unlimited sync
- Unlimited AI risk summaries & alignment suggestions
- Up to 10 users within one organization
Best for multiple teams, exec teams, or full-org deployments.
- All in Connect
- Unlimited users within one organization
- Direct human support email, 24h response time
- Human-led onboarding support
Free resources for this topic
A template you can download, a playbook to run, and the thinking behind both. No email required.
More on steering strategy, not just presenting it.
Two reads on the part of the role that decides whether the strategy lands: where effort is actually going, and how it drifts.
The role is measured on whether the strategy lands, yet most of it is spent describing strategy in decks while the work that decides its fate happens in tools you cannot see.
Capacity drifts away from the stated strategy one reasonable decision at a time, invisible until a quarter has already been spent on the wrong thing.
Common questions, answered
How does a Chief Strategy Officer use Vindaris?
What is the alignment graph?
How does Vindaris surface strategic risk early?
Can a Chief Strategy Officer create initiatives in Vindaris?
Steer the strategy before the quarter steers it for you.
Connect your first tool in 90 seconds. Free forever for goal management.
Run your week on VindarisNo credit card | No migration | No minimum contract