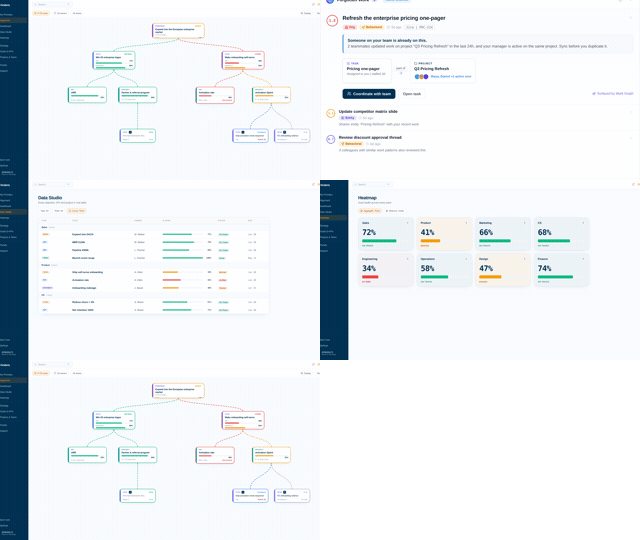
Run the company from one honest page, no status meeting required.
You need to know, on any morning, whether the company is on track and where to move people or money to protect the strategy. Vindaris gives you that read from real work, not from a deck someone polished on Friday.
The week a CEO actually runs on Vindaris.
You do not open a status tool five times a day. You glance at a few moments and trust the picture. Here is what each one looks like.
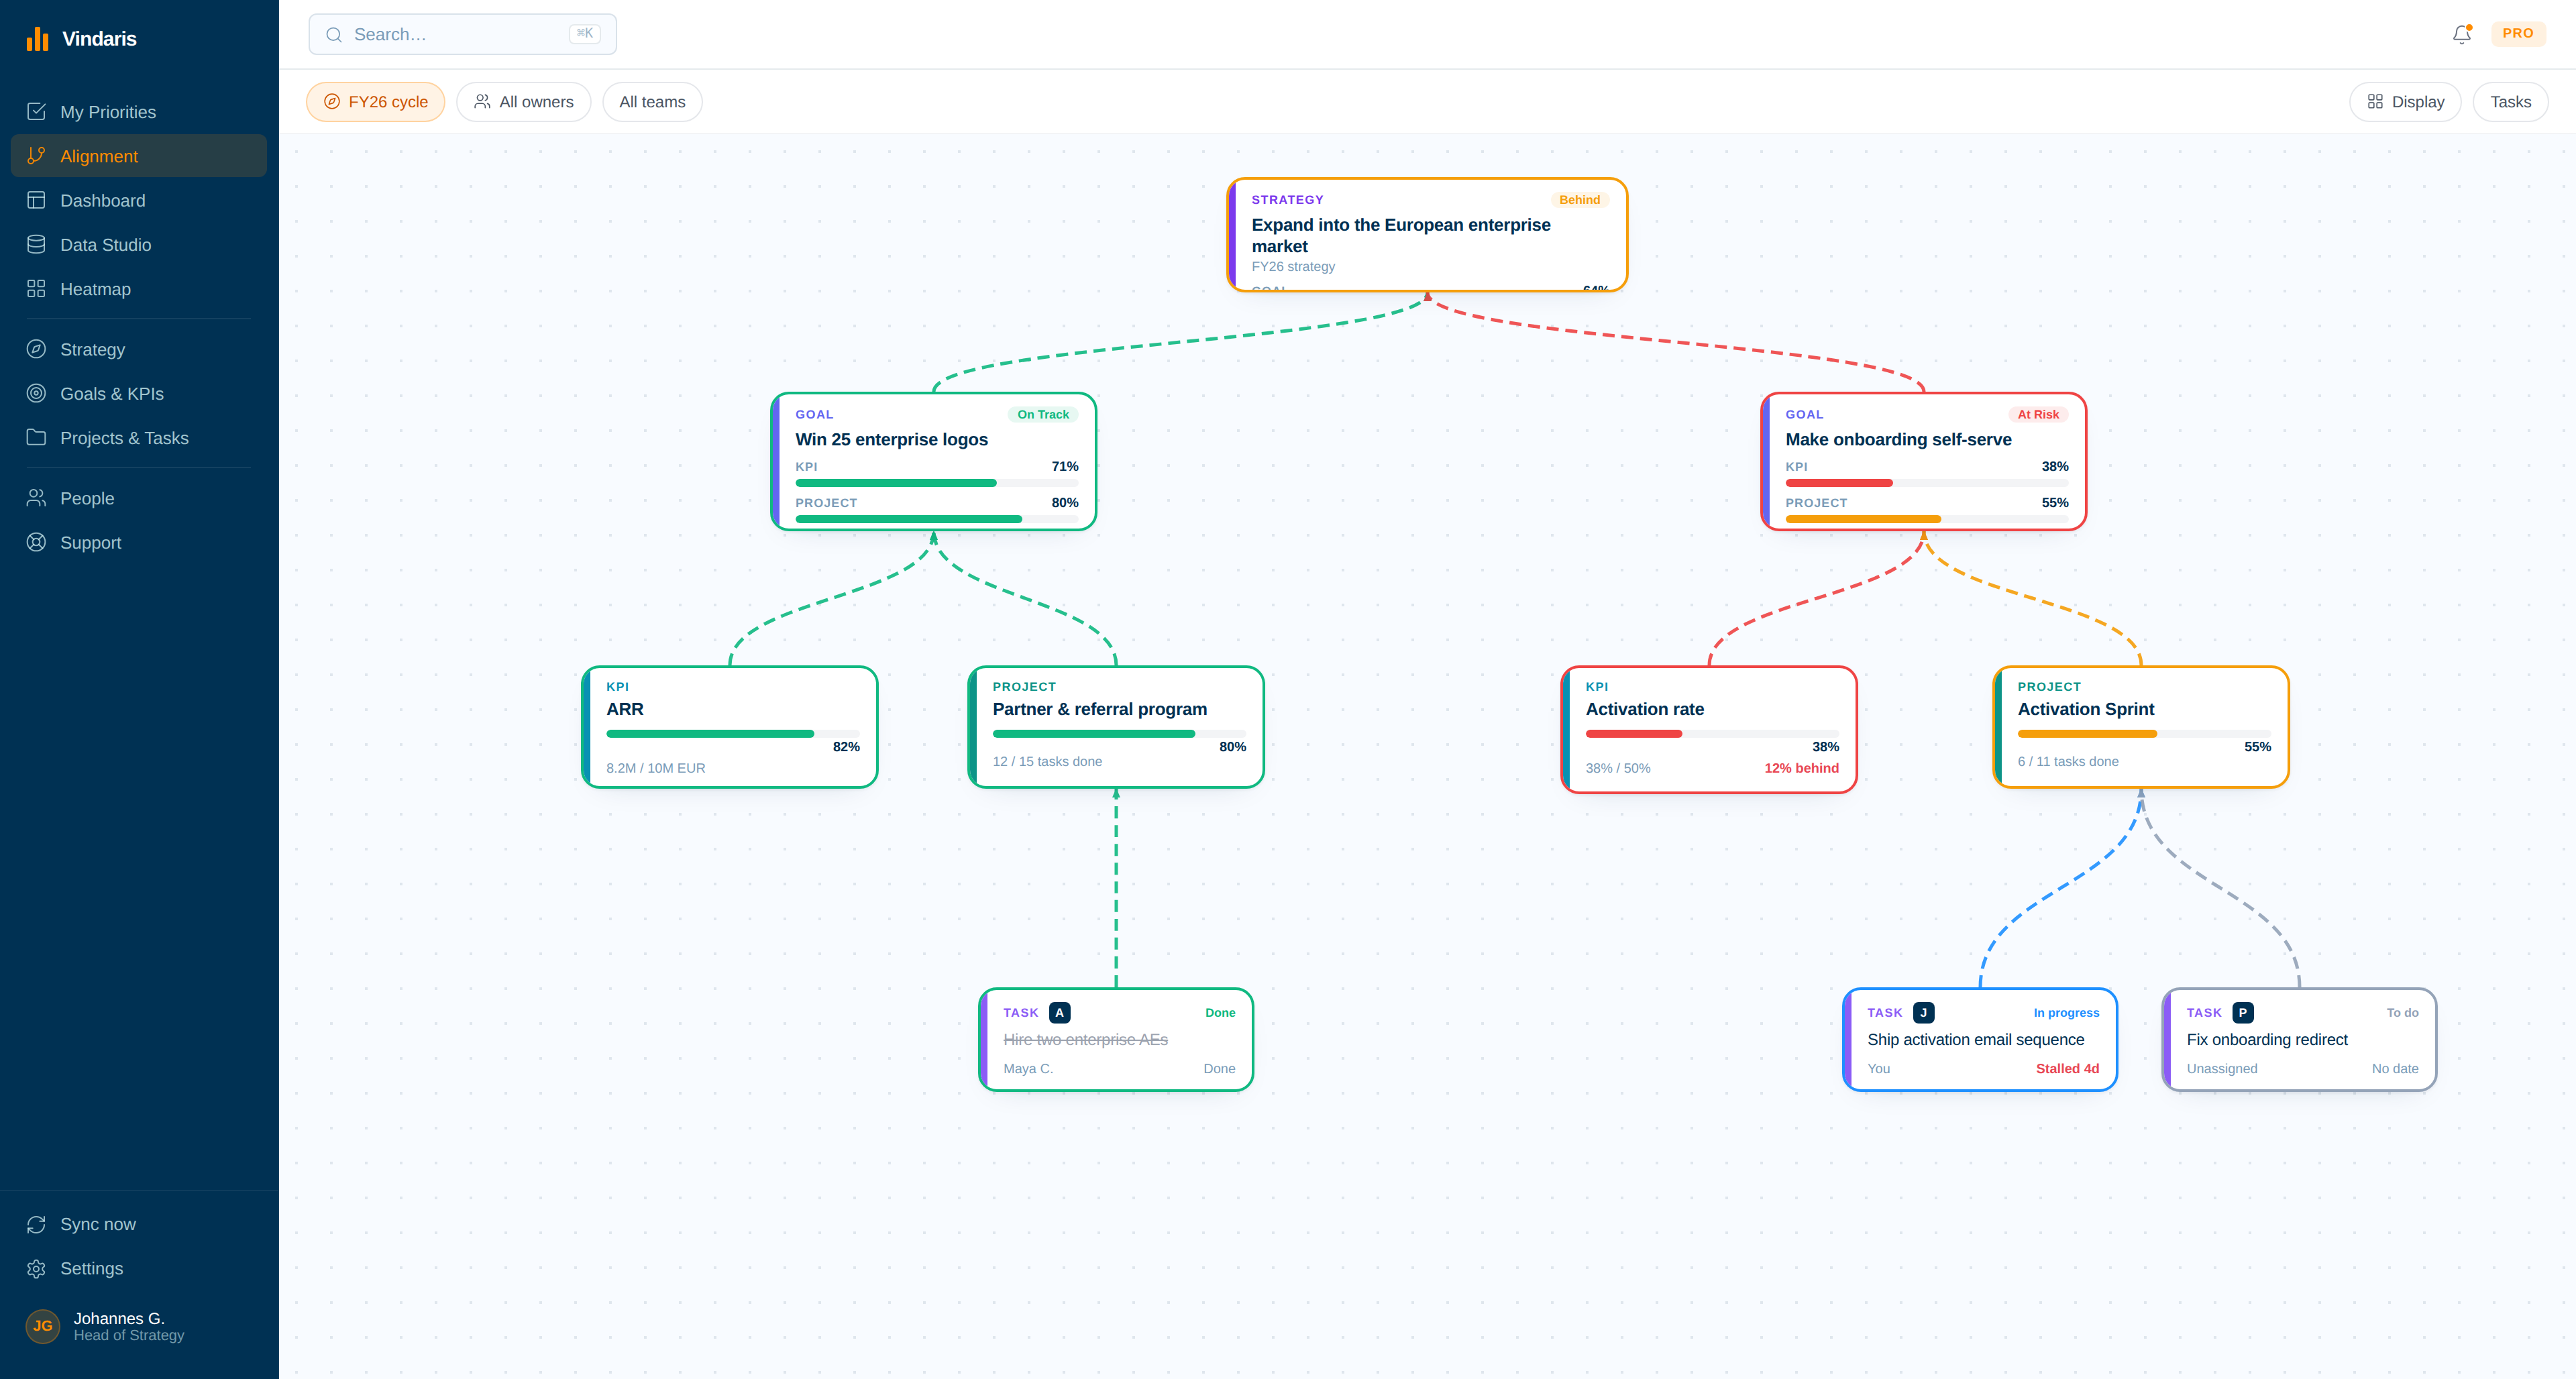
The whole company on one page, derived from real work.
Status decks tell you what someone wanted you to see last Friday. Vindaris shows you what the work is actually doing, rolled up from the tools your teams already use, so the picture in front of you is current and honest.
Open the week with a written read on where the strategy stands, what moved, and what is at risk. It is generated from the work, not pasted in from a deck.
You hear about a slipping objective the moment the work behind it stalls, not at the review three weeks later when the quarter is already lost.
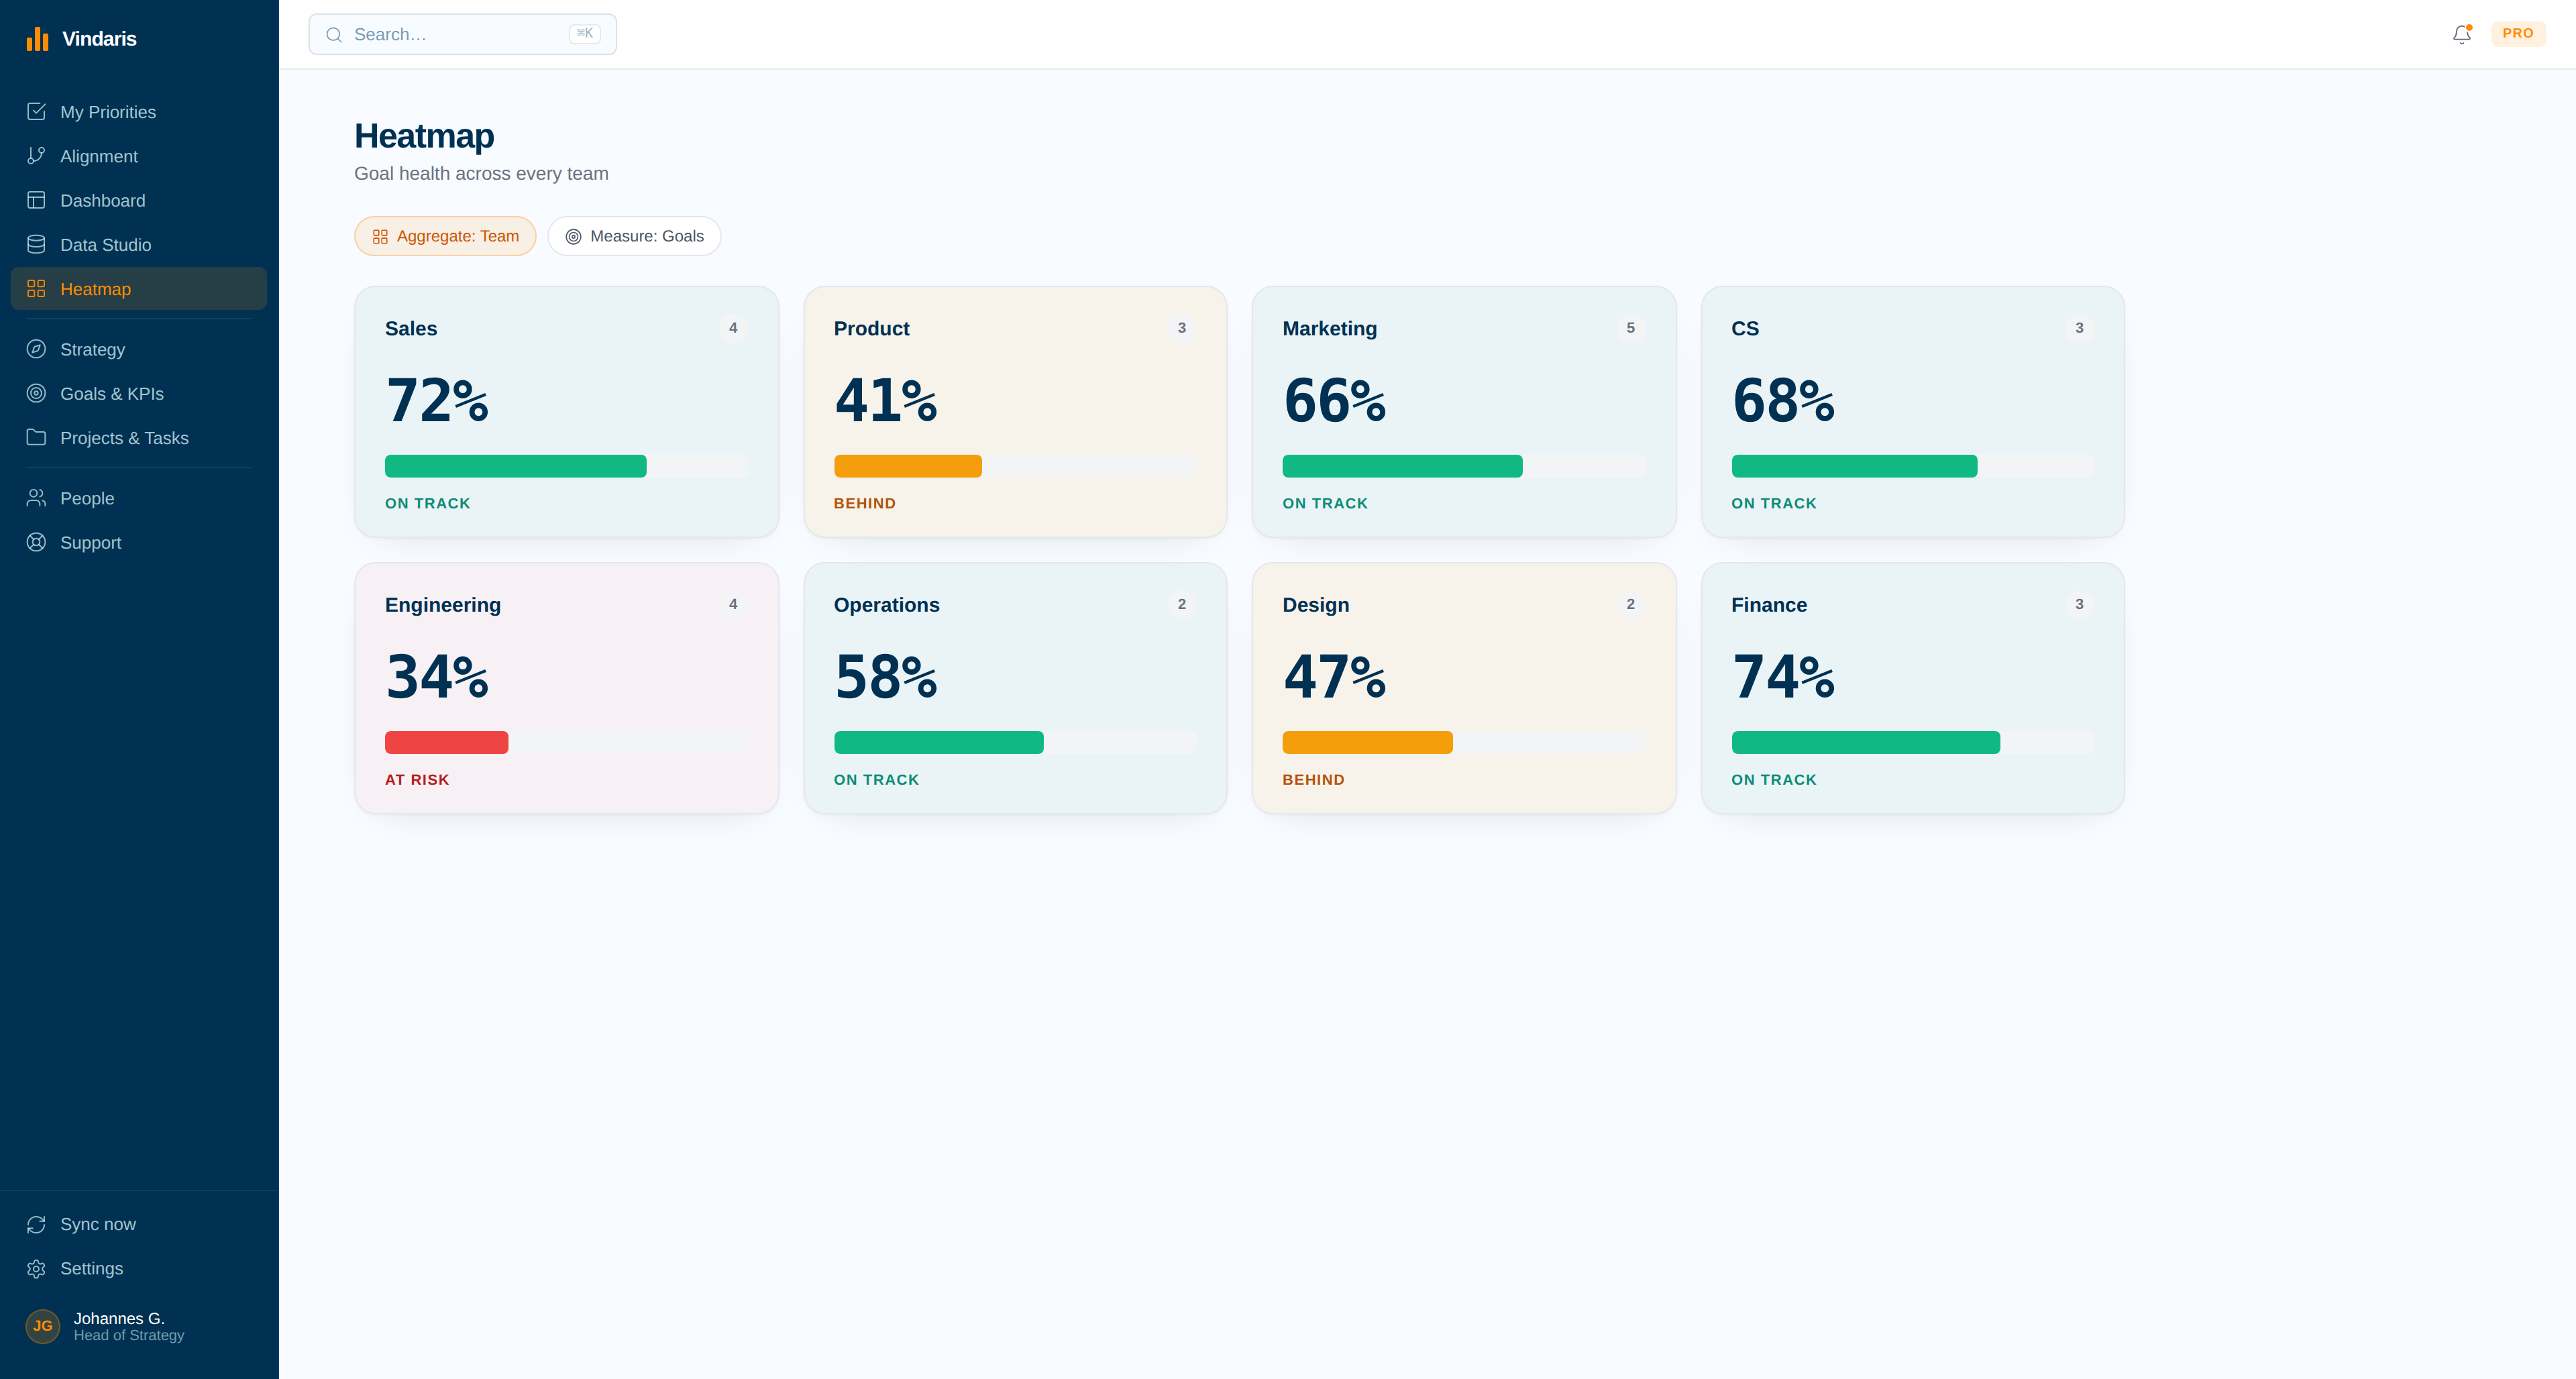
See the health of every team and strategic initiative at a glance. The red cells tell you where to spend your attention before anyone has to ask.
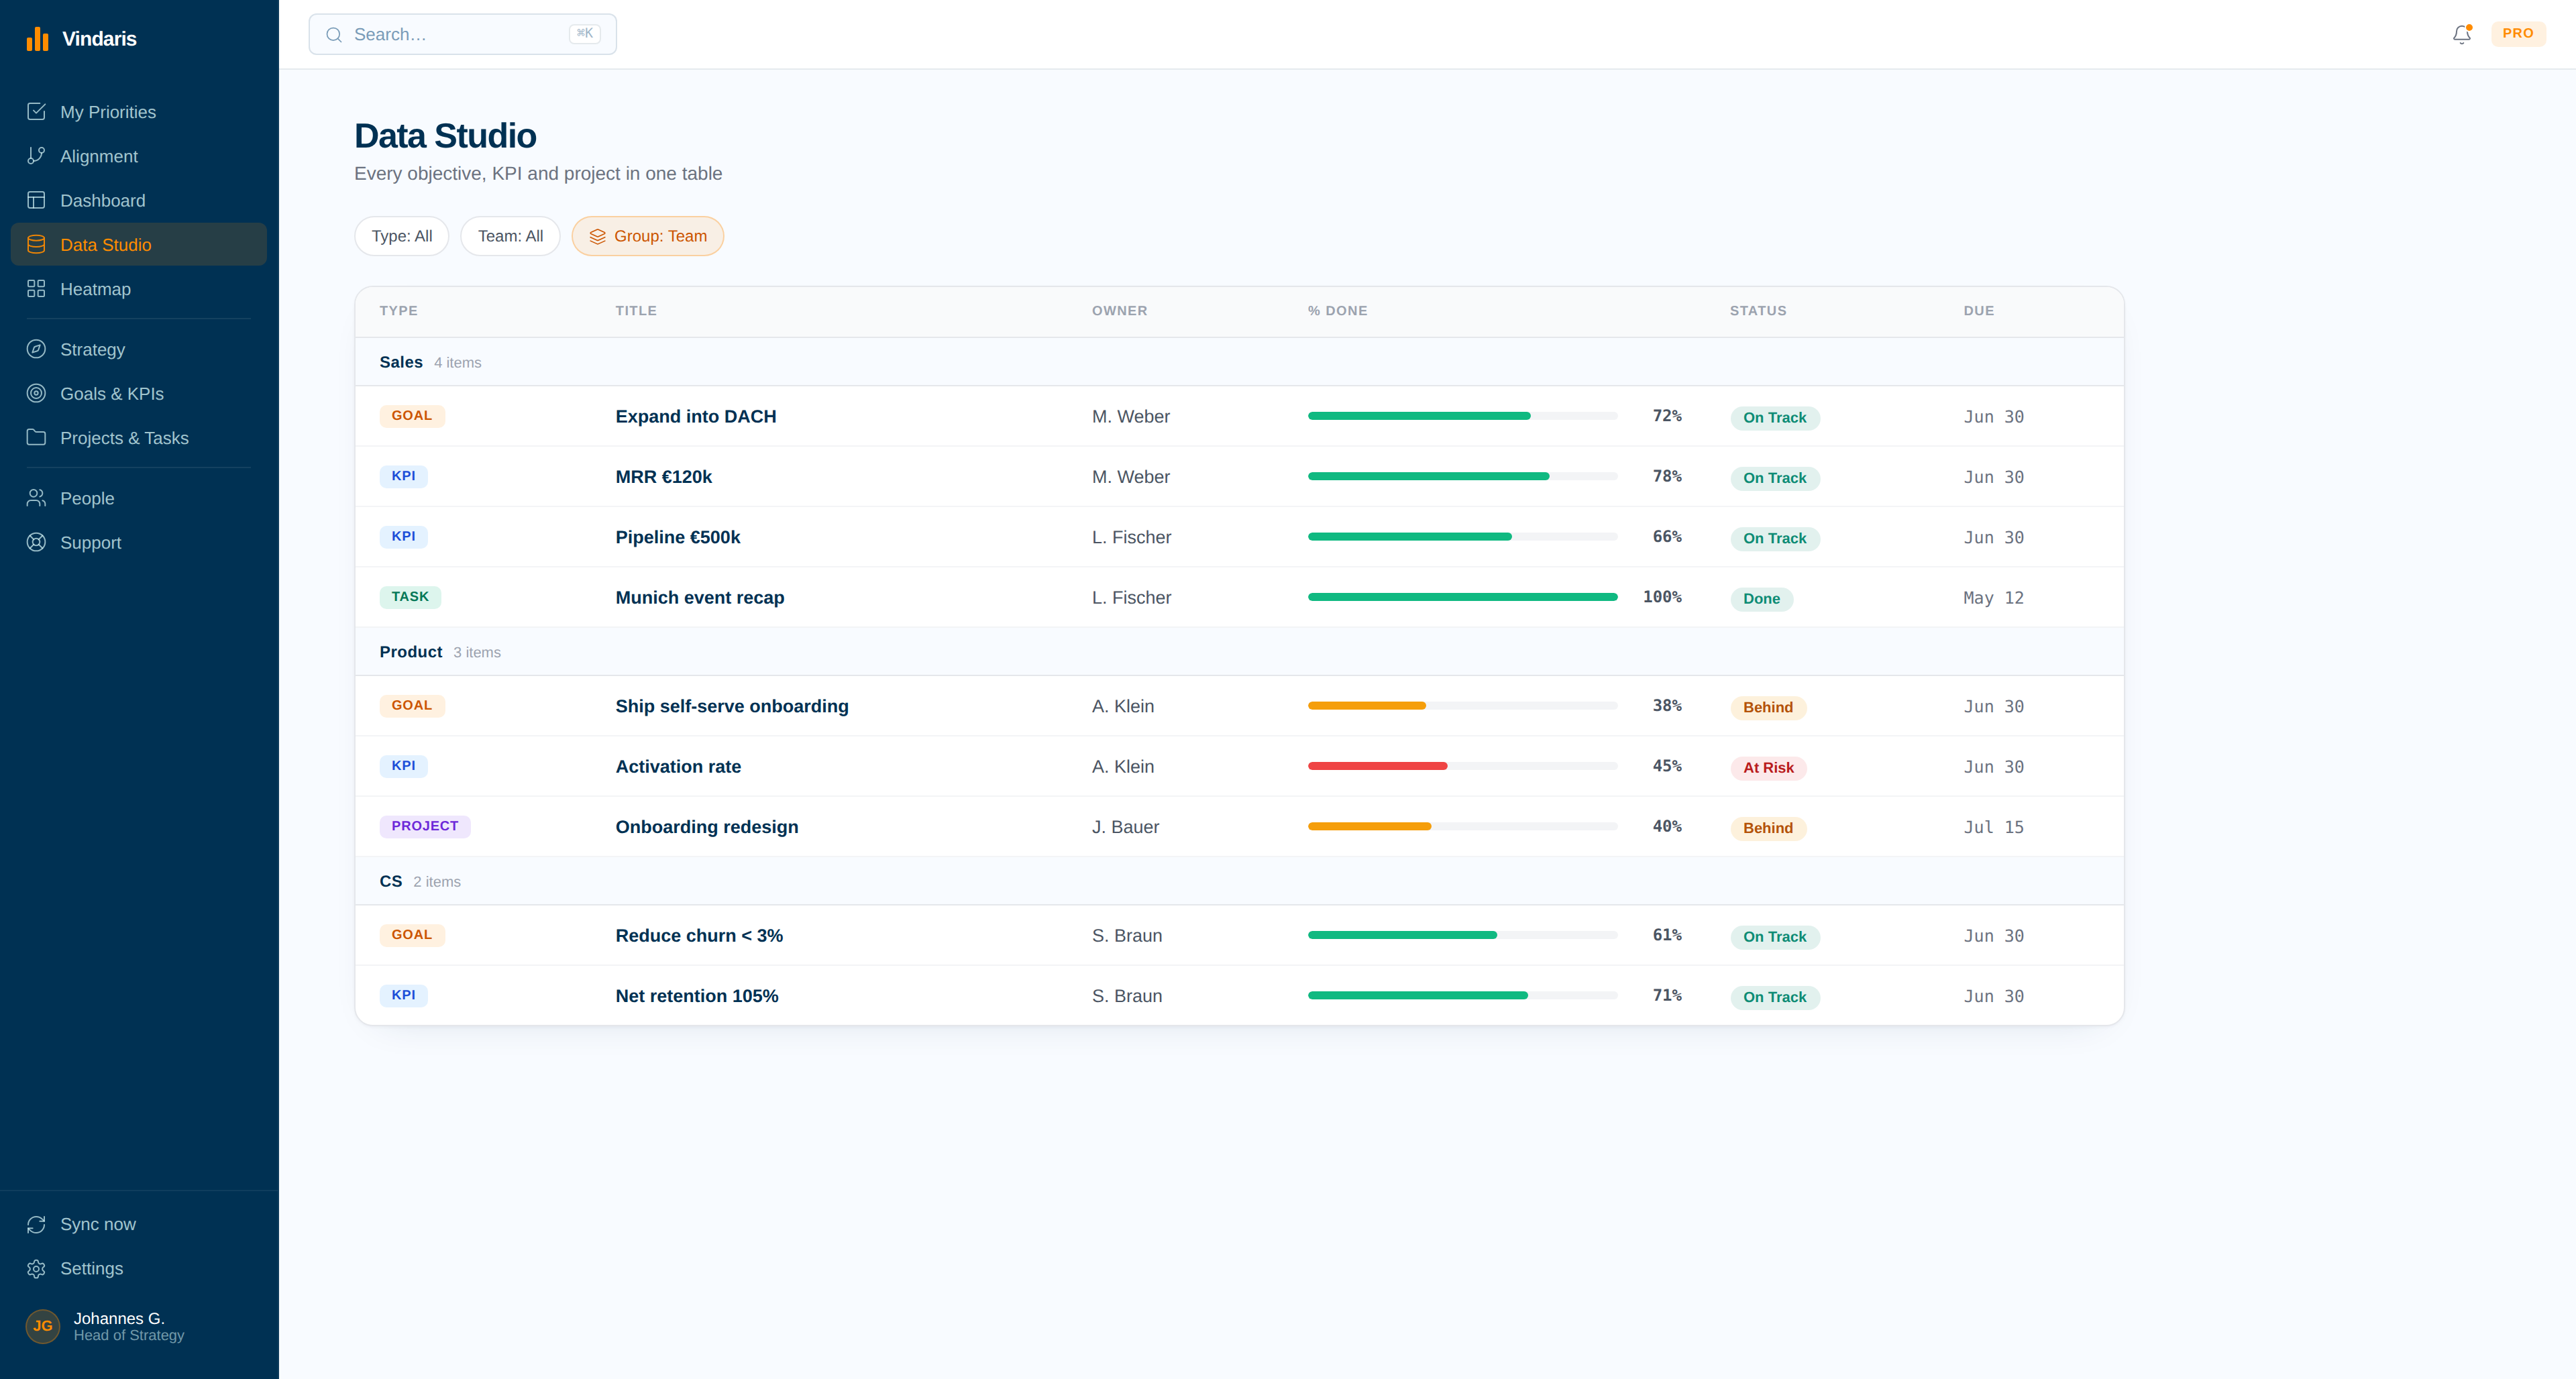
Track the trend of achievement over time, not just today's number. A goal that is green but falling is a different decision than one that is climbing.
When the heatmap shows risk, the alignment view shows you which bets are starved and which are over-resourced, so a reallocation call is grounded in data.
Every objective has a named owner and every person has a clear view of what they own. Nothing important is sitting in the gap between two teams.
Five mornings, no status meeting.
This is a week run from the work itself. The cadence stays the same whether you lead 40 people or 400.
Read the AI summary
Start the week with the generated summary of where the strategy stands. Five minutes tells you what moved over the weekend and what needs a decision this week.
Act on a red alert
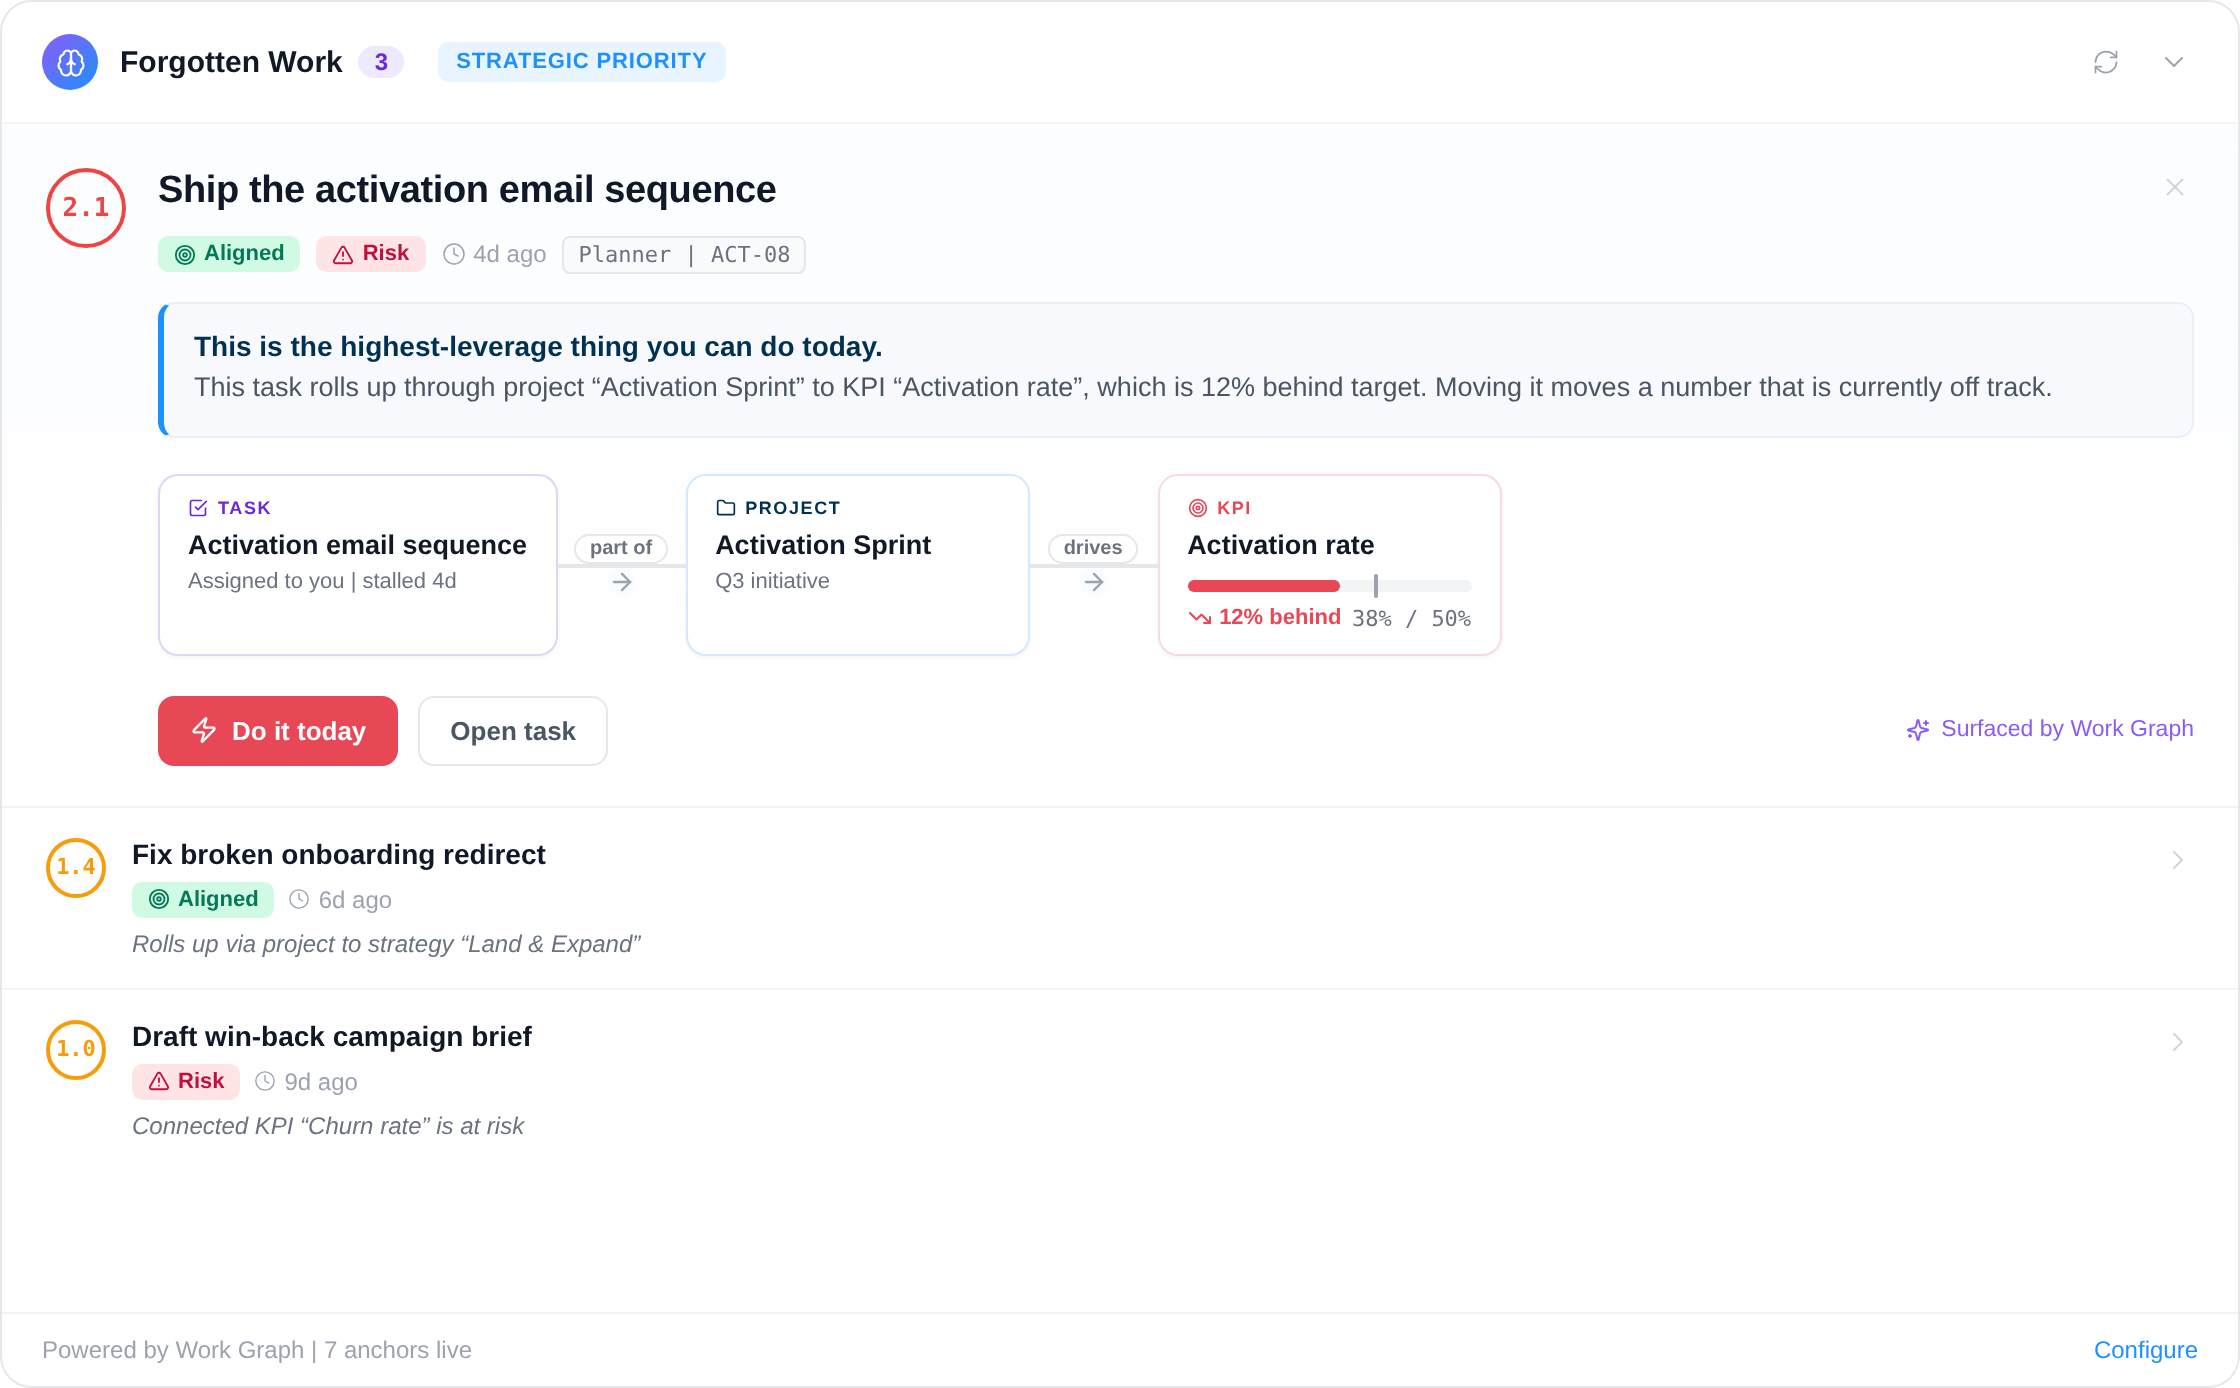
An alert fires: a flagship initiative has stalled because its underlying work has not moved in two weeks. You ping the owner with the context already attached, before it becomes a missed milestone.
Scan the heatmap
One look across teams and initiatives shows two cells turning amber. You note them for the leadership sync instead of waiting for them to go red.
Reallocate with the alignment view
The alignment view shows a priority bet with no real work behind it while a lower priority is fully staffed. You shift capacity and the change is visible to everyone immediately.
Check the trend, not the snapshot
Dashboards show achievement trending up across most goals and flat on one. You close the week knowing exactly which conversation Monday needs to start with.
Lead from what the work is doing, not from what the deck says.
Most CEOs run the company on a lag. Status arrives hand-typed, a week stale, filtered through whoever wrote the update. By the time a goal shows red in a board pack, the work behind it stopped moving a month earlier. You make capital and people decisions on a picture the company has already moved past.
Vindaris closes that lag. Work syncs from the tools your teams already use and rolls up to the strategy automatically, so the AI summary, the heatmap, and the dashboards all reflect what is actually happening today. The alignment view confirms every person knows what they own, and when a bet is starved you see it in time to move resources. You stop chairing status meetings and start making the two or three decisions that actually move the quarter.
Risk reaches you before it reaches the board deck.
The Work Graph reads the edges between your goals and the work beneath them. When a connected initiative slips, a routine breaks, or focus drifts, the owner hears about it first, with the reason already attached. You spend the morning on the two calls that matter, not on a status round.
Free forever, including two integrations
Start free with full goal and strategy management. Add two integrations to sync tasks. Pay only when you add more than 4 people, need more integrations, or more AI summaries.
Best for individual contributors, small teams or startups. No credit card required.
- All features (incl. Alignment Canvas, My Priorities, Heatmap, Data Studio & Task Board)
- Set up 2 integrations of your choice
- Invite up to 4 additional members
- 5 ad-hoc AI risk summaries per month
Best for teams, small agencies, or departmental and team management.
- All in Free
- All integrations, unlimited sync
- Unlimited AI risk summaries & alignment suggestions
- Up to 10 users within one organization
Best for multiple teams, exec teams, or full-org deployments.
- All in Connect
- Unlimited users within one organization
- Direct human support email, 24h response time
- Human-led onboarding support
Free resources for this topic
A template you can download, a playbook to run, and the thinking behind both. No email required.
More on running the company from real signal.
Two reads on the same problem this page solves: leading from what the work is doing instead of what the deck says.
A deliberately designed rhythm does different work at every layer: weekly drift control, monthly portfolio review, quarterly bet review, and an annual that is the smallest event, not the largest.
By the time status reaches the board deck, it has been smoothed, contextualised, and stripped of the signal a CEO actually needs to act on.
Common questions, answered
How does a CEO use Vindaris?
Does Vindaris replace the weekly status meeting for leadership?
How does a CEO know where to reallocate resources?
Does the CEO need every team on the same framework?
Know if you are on track, every morning.
Connect your first tool in 90 seconds. Free forever for goal management.
Run your week on VindarisNo credit card | No migration | No minimum contract