OGSM software that keeps the plan connected to the work.
Vindaris links every Objective, Goal, Strategy and Measure to the projects and tasks carrying them, so the plan reports on itself instead of waiting for the next update round.





What is OGSM?
OGSM is a one-page planning framework: an Objective in words, Goals that make it measurable, Strategies describing how you will get there, and Measures that tell you whether each Strategy is working. Its discipline is the single page. Its weakness is that a page has no room for the work underneath.
How is OGSM different from OKR?
OGSM separates the qualitative Objective from the quantitative Goals and puts the how, the Strategies, on the same page as the what. OKRs collapse those into objectives and key results. OGSM suits companies that want the strategic choice visible; OKRs suit companies that want the target visible.
What goes in the Measures row?
Leading indicators for each Strategy rather than restatements of the Goals. The most common OGSM mistake is filling the Measures row with the same numbers already in the Goals row, which leaves you unable to tell whether a Strategy is failing or simply has not been executed yet.
Does OGSM work below the leadership team?
It cascades reasonably: a Strategy at company level becomes an Objective for the team that owns it. The cascade breaks where most frameworks break, at the point where a team's Strategies have to become actual projects, because the one-pager has no room for them.
Can OGSM be tracked automatically?
The Measures can, if the Strategies underneath them connect to real projects. That is what Vindaris adds: the one-pager keeps its structure and gains a layer below it, so a Measure moves when the work delivering its Strategy moves rather than when someone updates the page.
 Click thru live demo
Pre-built workspace. No signup.
Click thru live demo
Pre-built workspace. No signup.
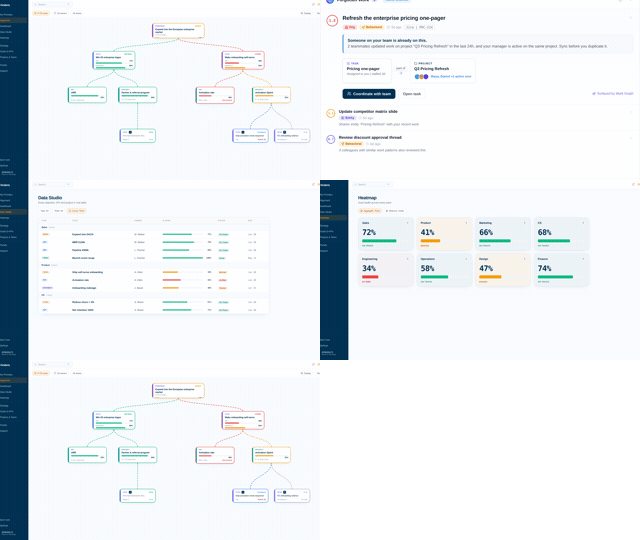
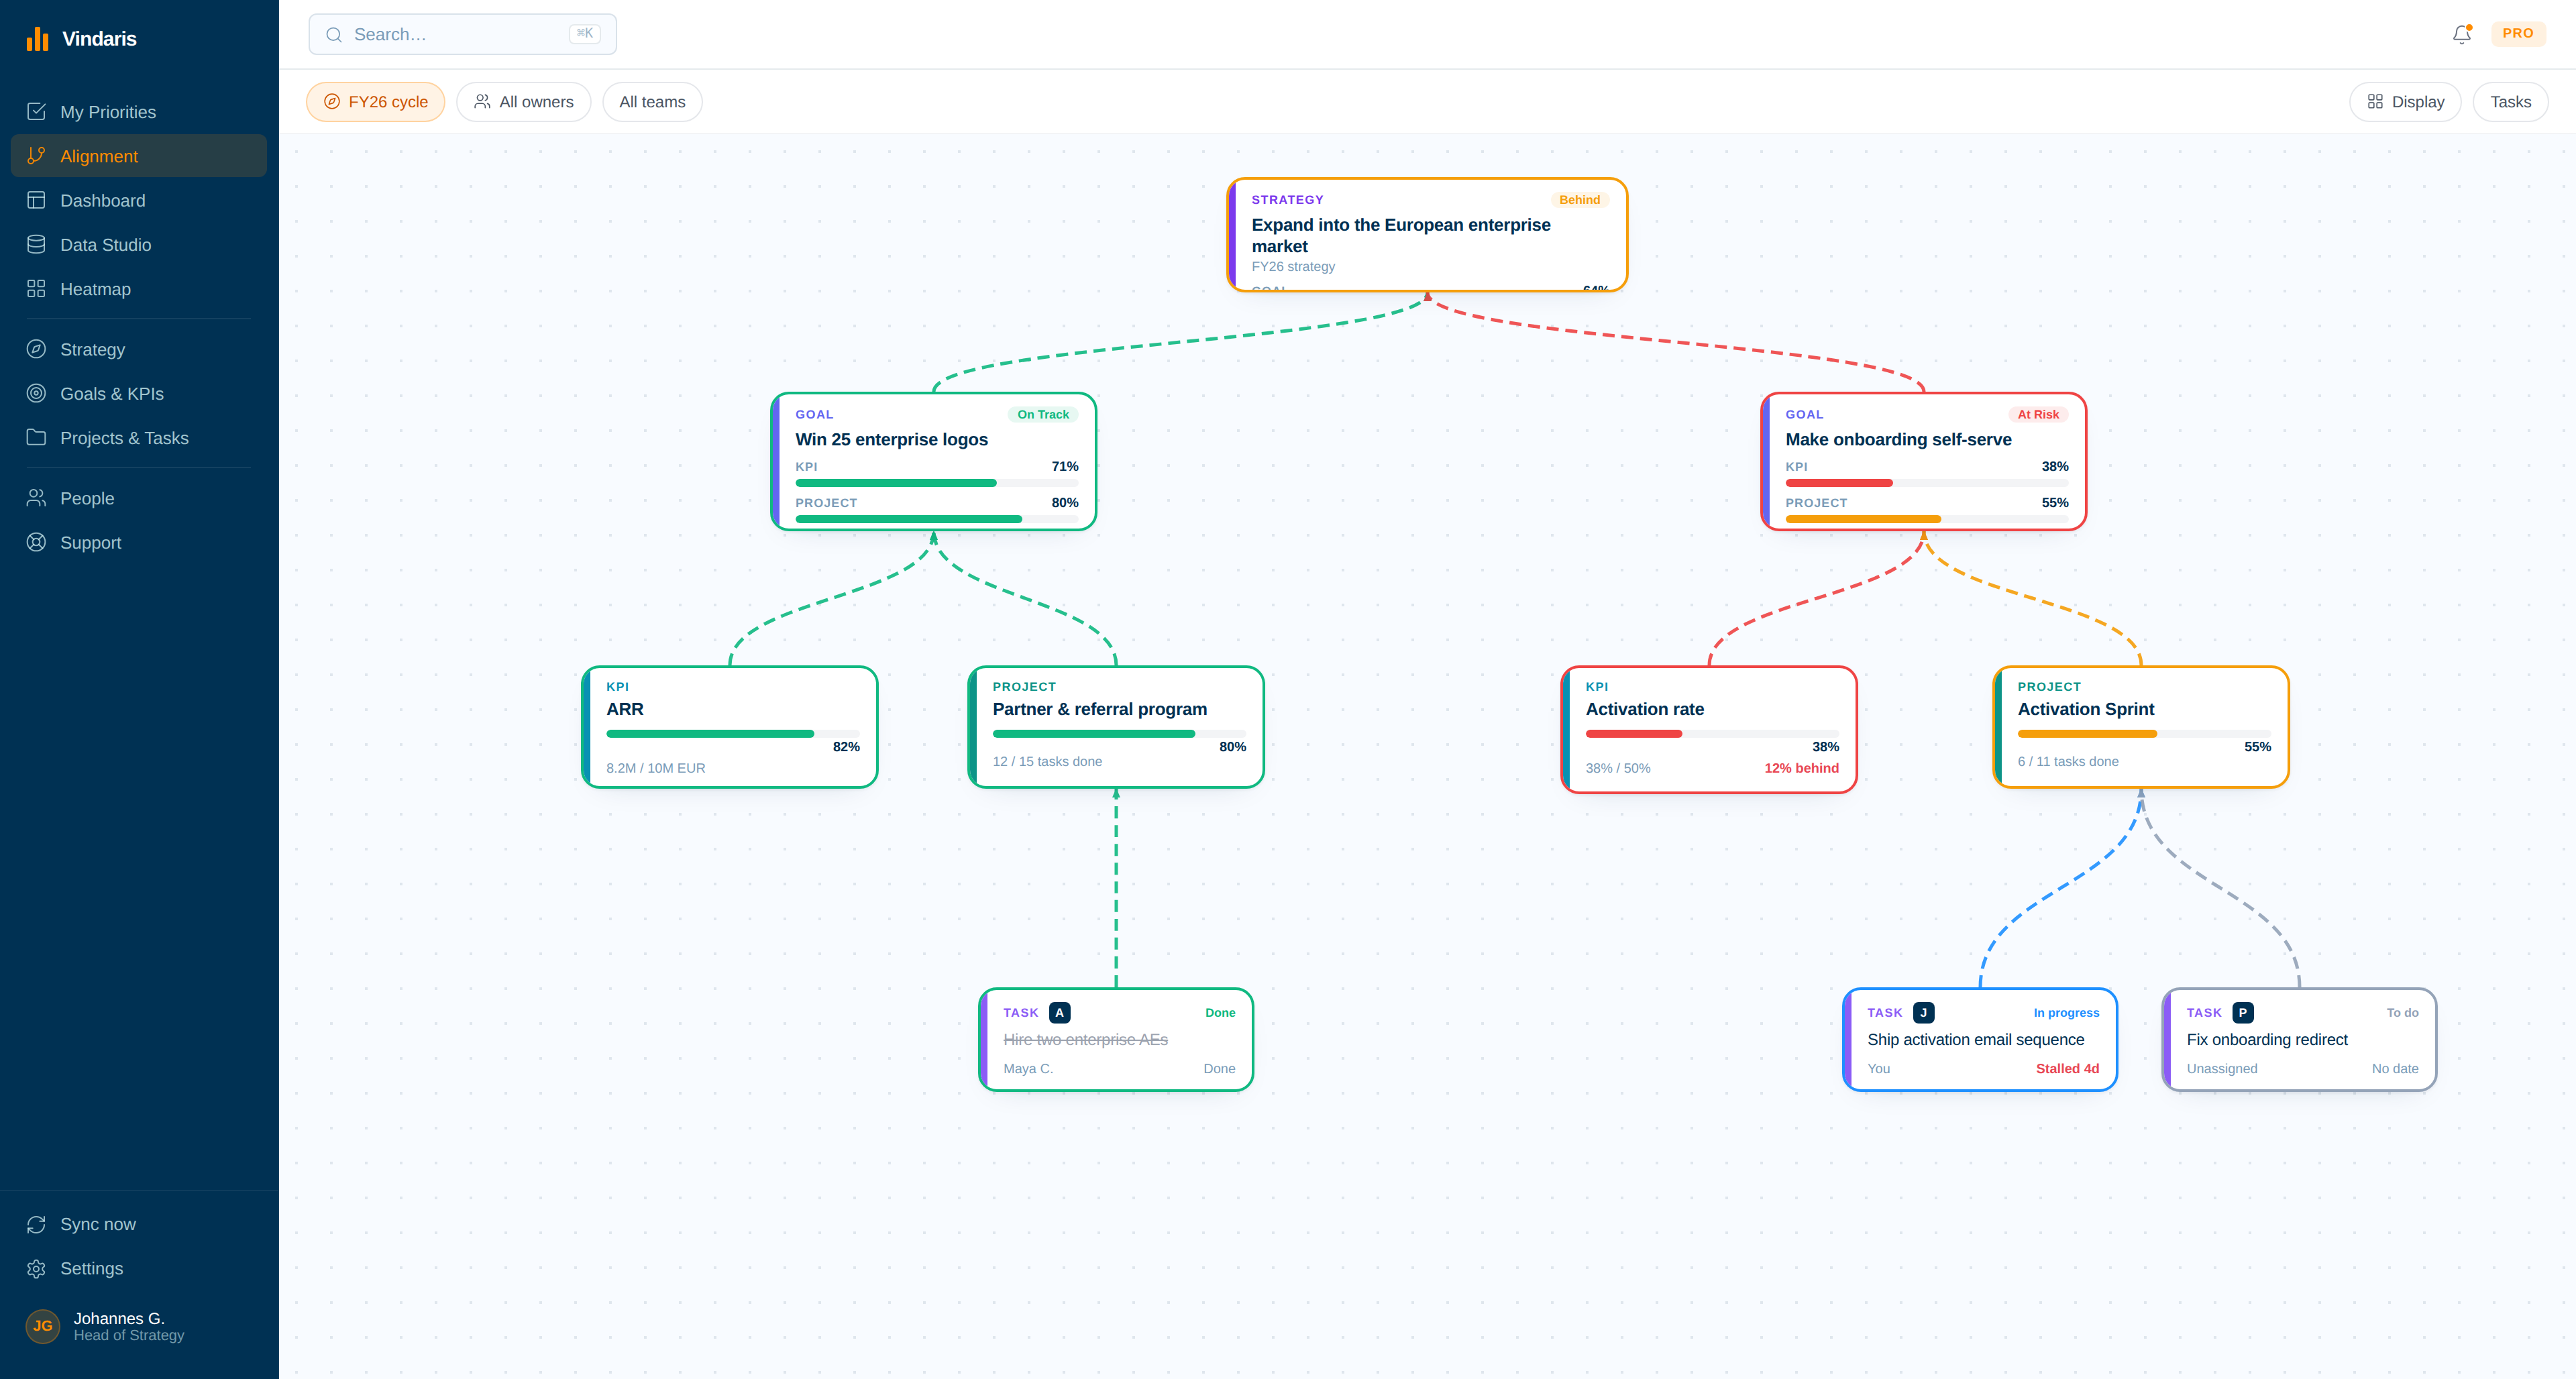
The one-page plan as a live board: the Objective at the top, Goals and Measures beneath it, and the Strategies with the real projects and tasks carrying them. Click through the live workspace, no signup.
The one-pager, before you commit to it.
OGSM is strongest at the moment it is written and weakest six months later, when the page still says a Strategy is working and nothing has checked.
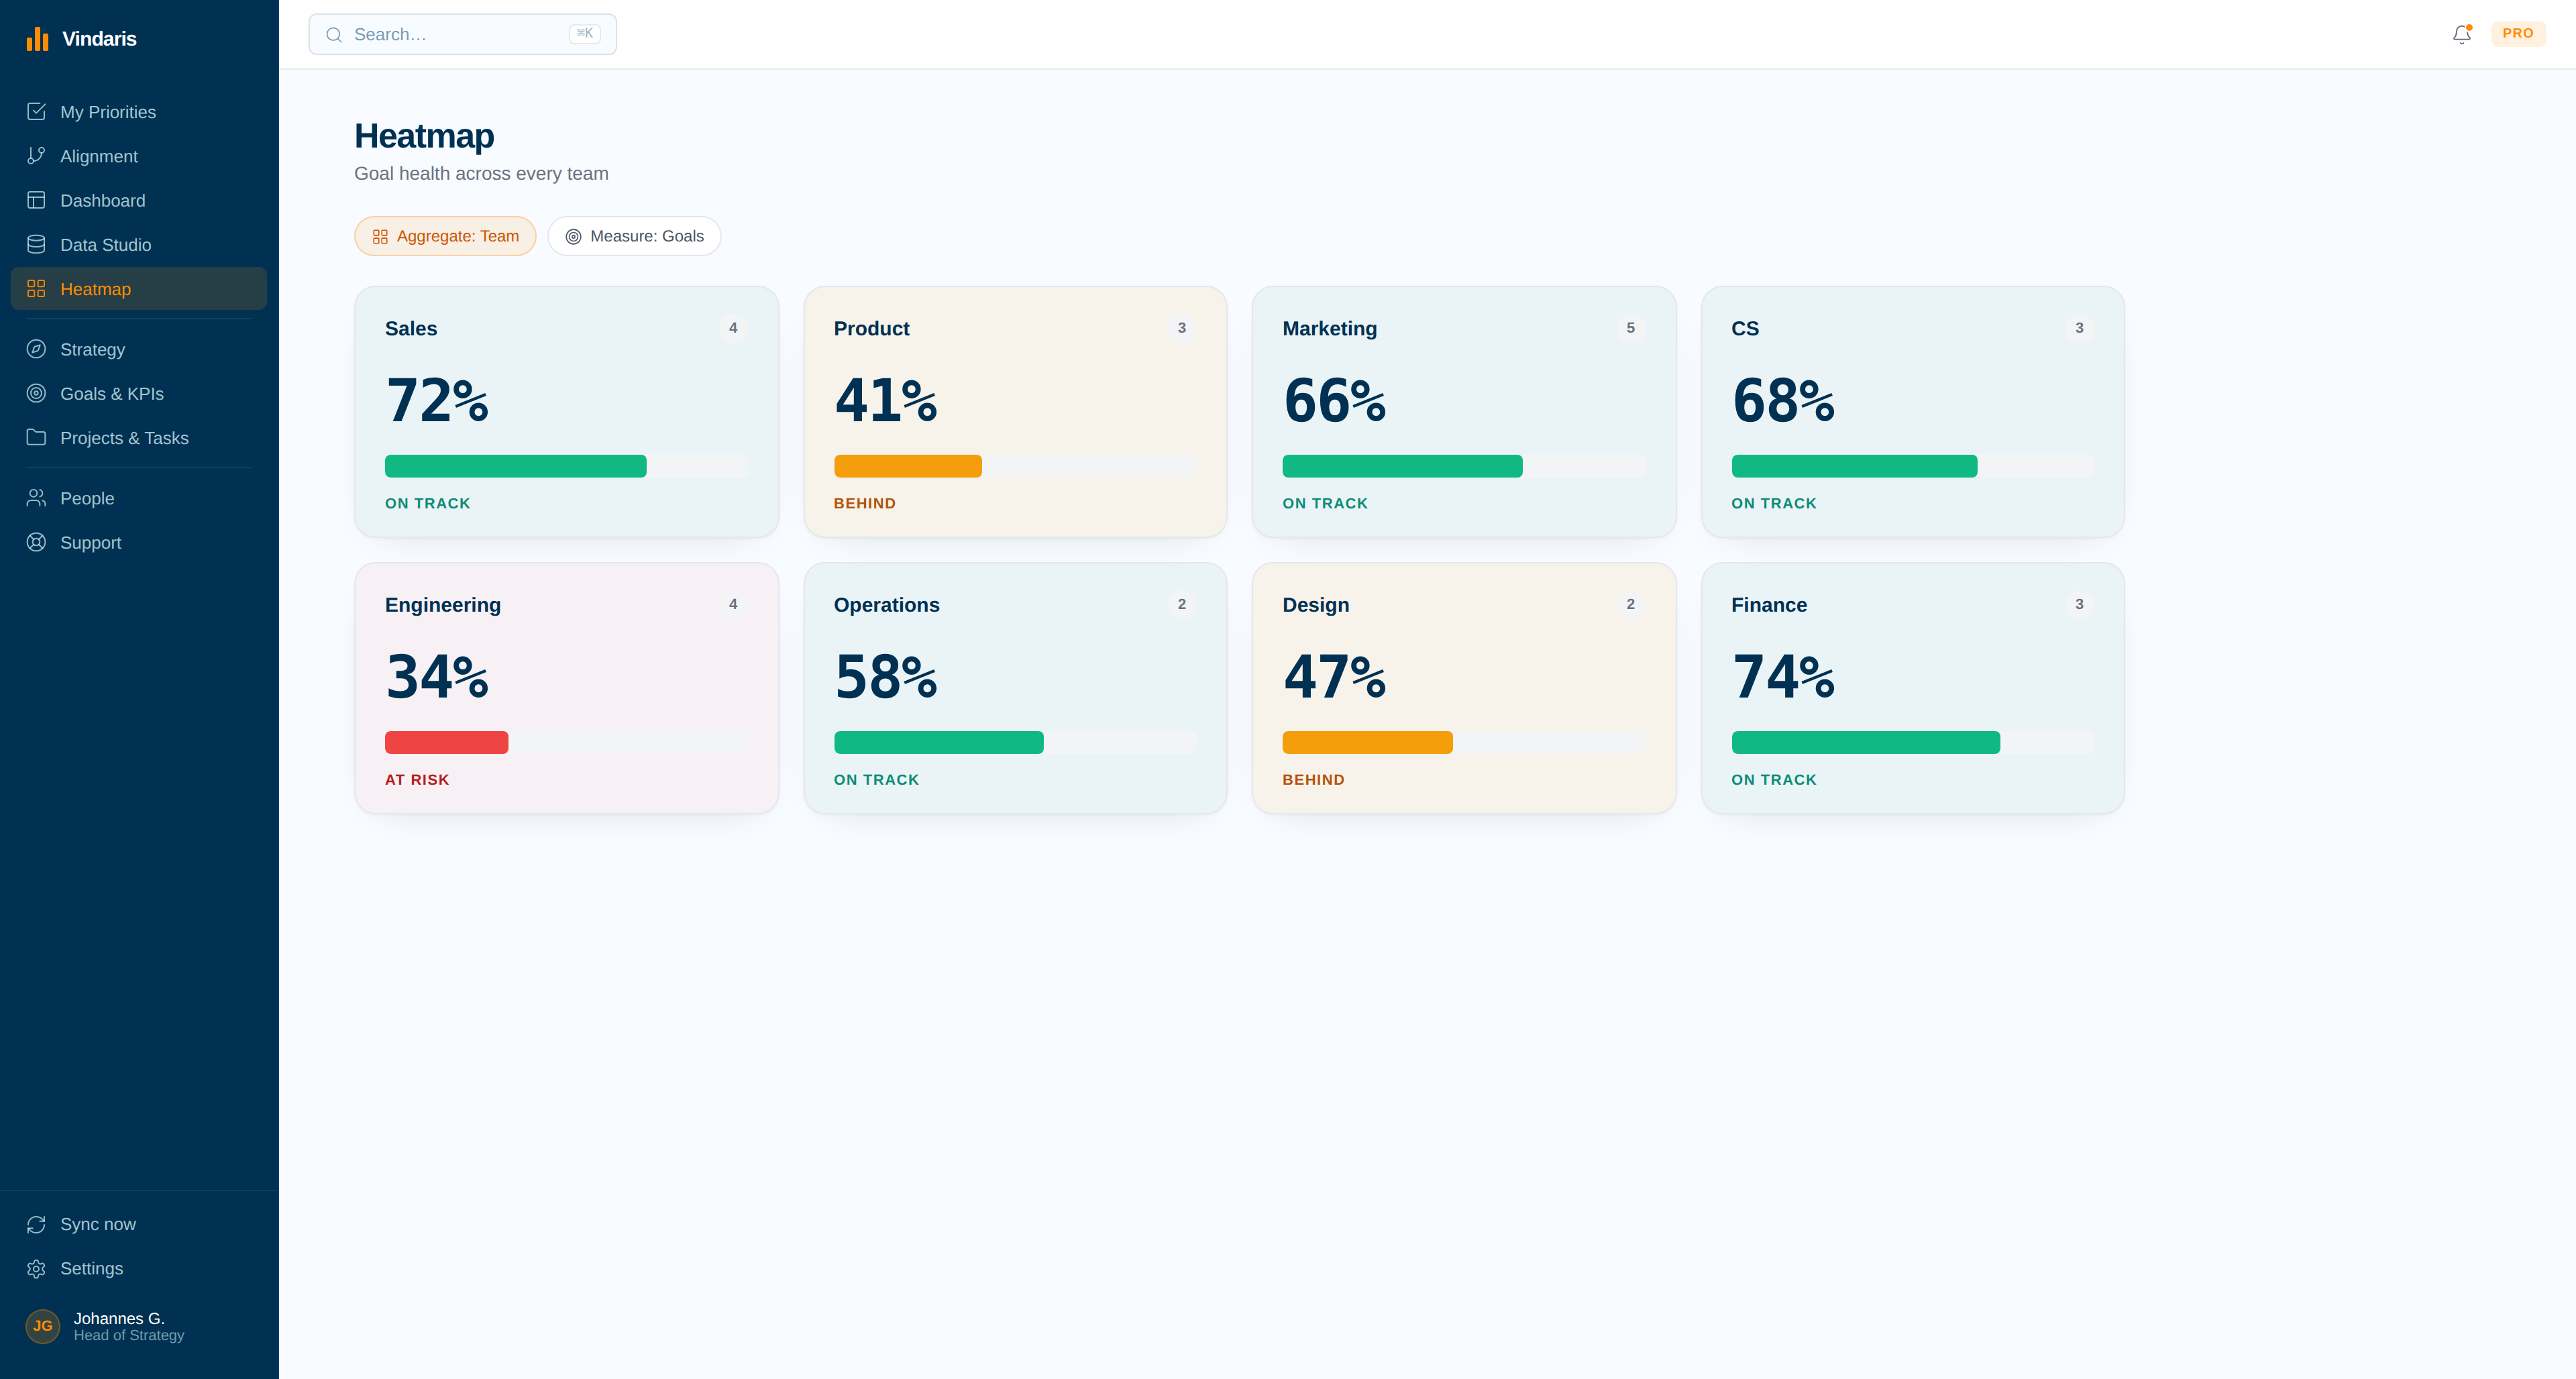
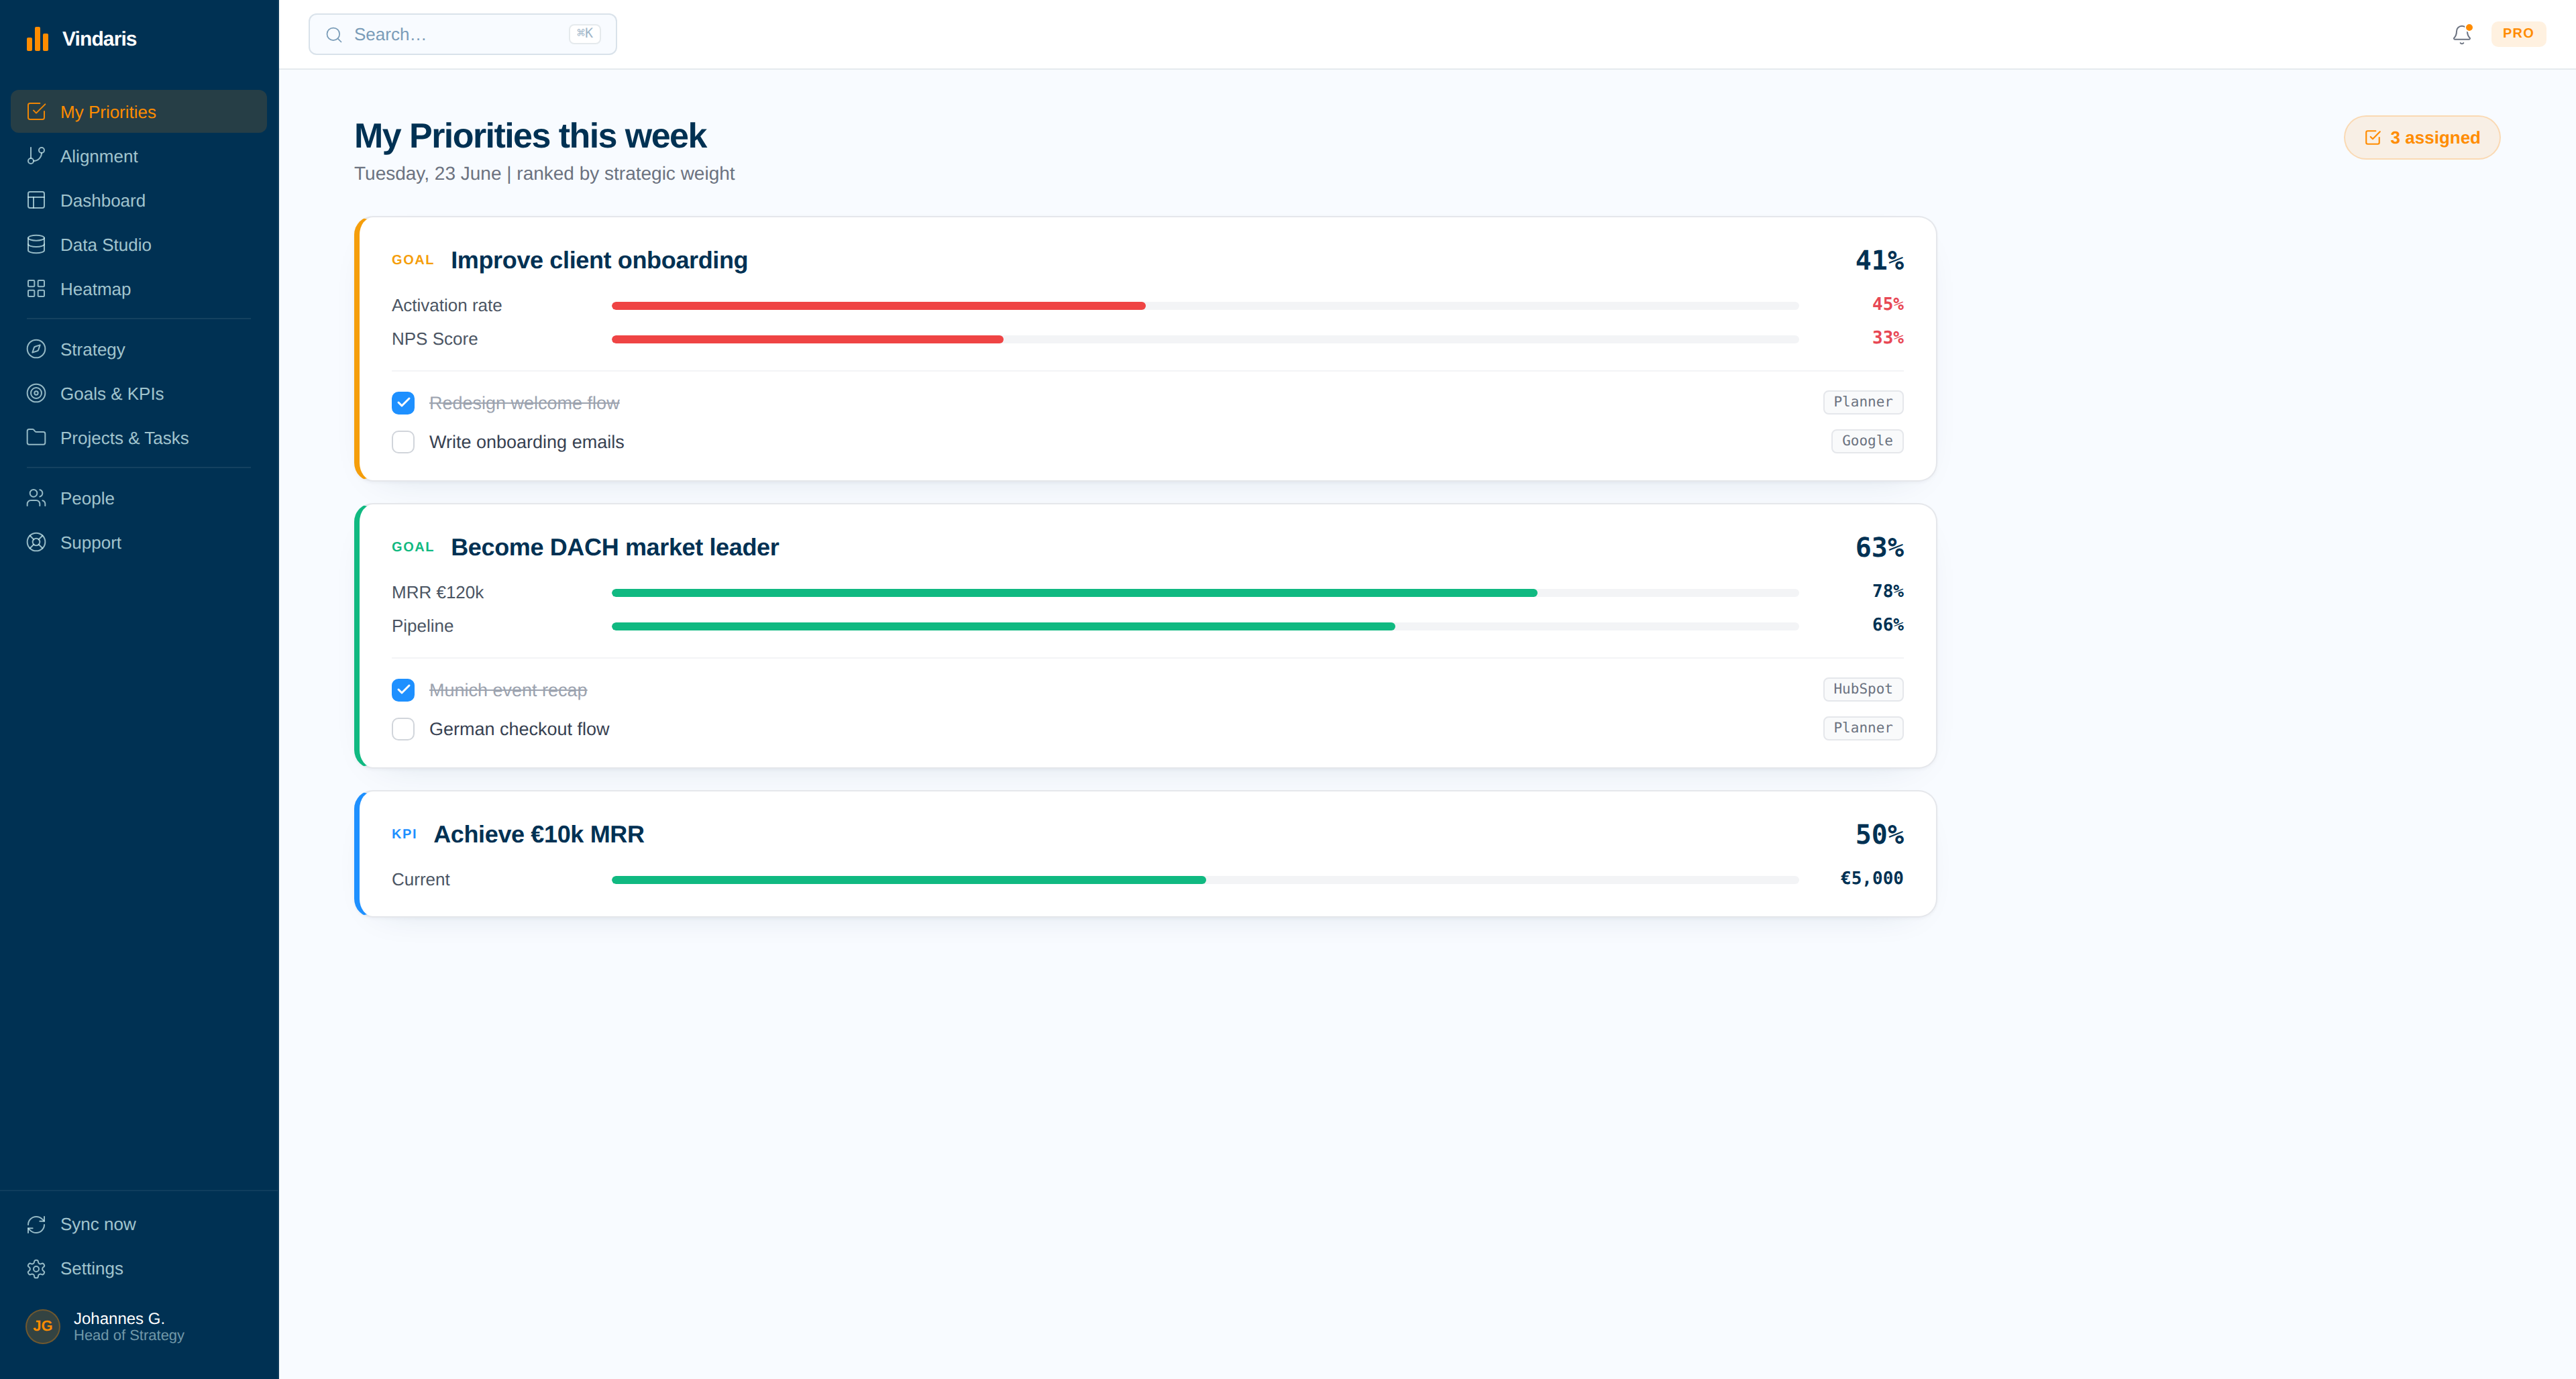
One page at the top. Four levels underneath it.
OGSM earns its keep by fitting on a page, and loses it the moment someone asks what is actually being done about a Strategy that is behind. Vindaris keeps the page and adds the layer below it.
Objective, Goals, Strategies, Measures
The four levels keep their names and their relationships rather than being flattened into objectives and key results. A Strategy stays a choice about how, and a Measure stays the proof that the choice is working.
Leading indicators that lead
The most common OGSM mistake is filling the Measures row with restated Goals, which leaves you unable to tell a failing Strategy from an unexecuted one. When Measures read from the projects under each Strategy, the difference is visible.
Work stays where it lives
Connect HubSpot, Jira, Planner, Asana and Google Tasks. Each Strategy keeps its delivery where it happens, and its Measures move as that work closes rather than as someone updates the one-pager.
Build your OGSM hierarchy
Lay the Objective, its Goals, the Strategies chosen to reach them and the Measures proving each one onto a single canvas. The one-pager stays a one-pager; the canvas is what sits behind it.
- Each level keeps its OGSM name and its own card type.
- One Strategy can serve two Goals without being written twice.
Query the Measures like a database
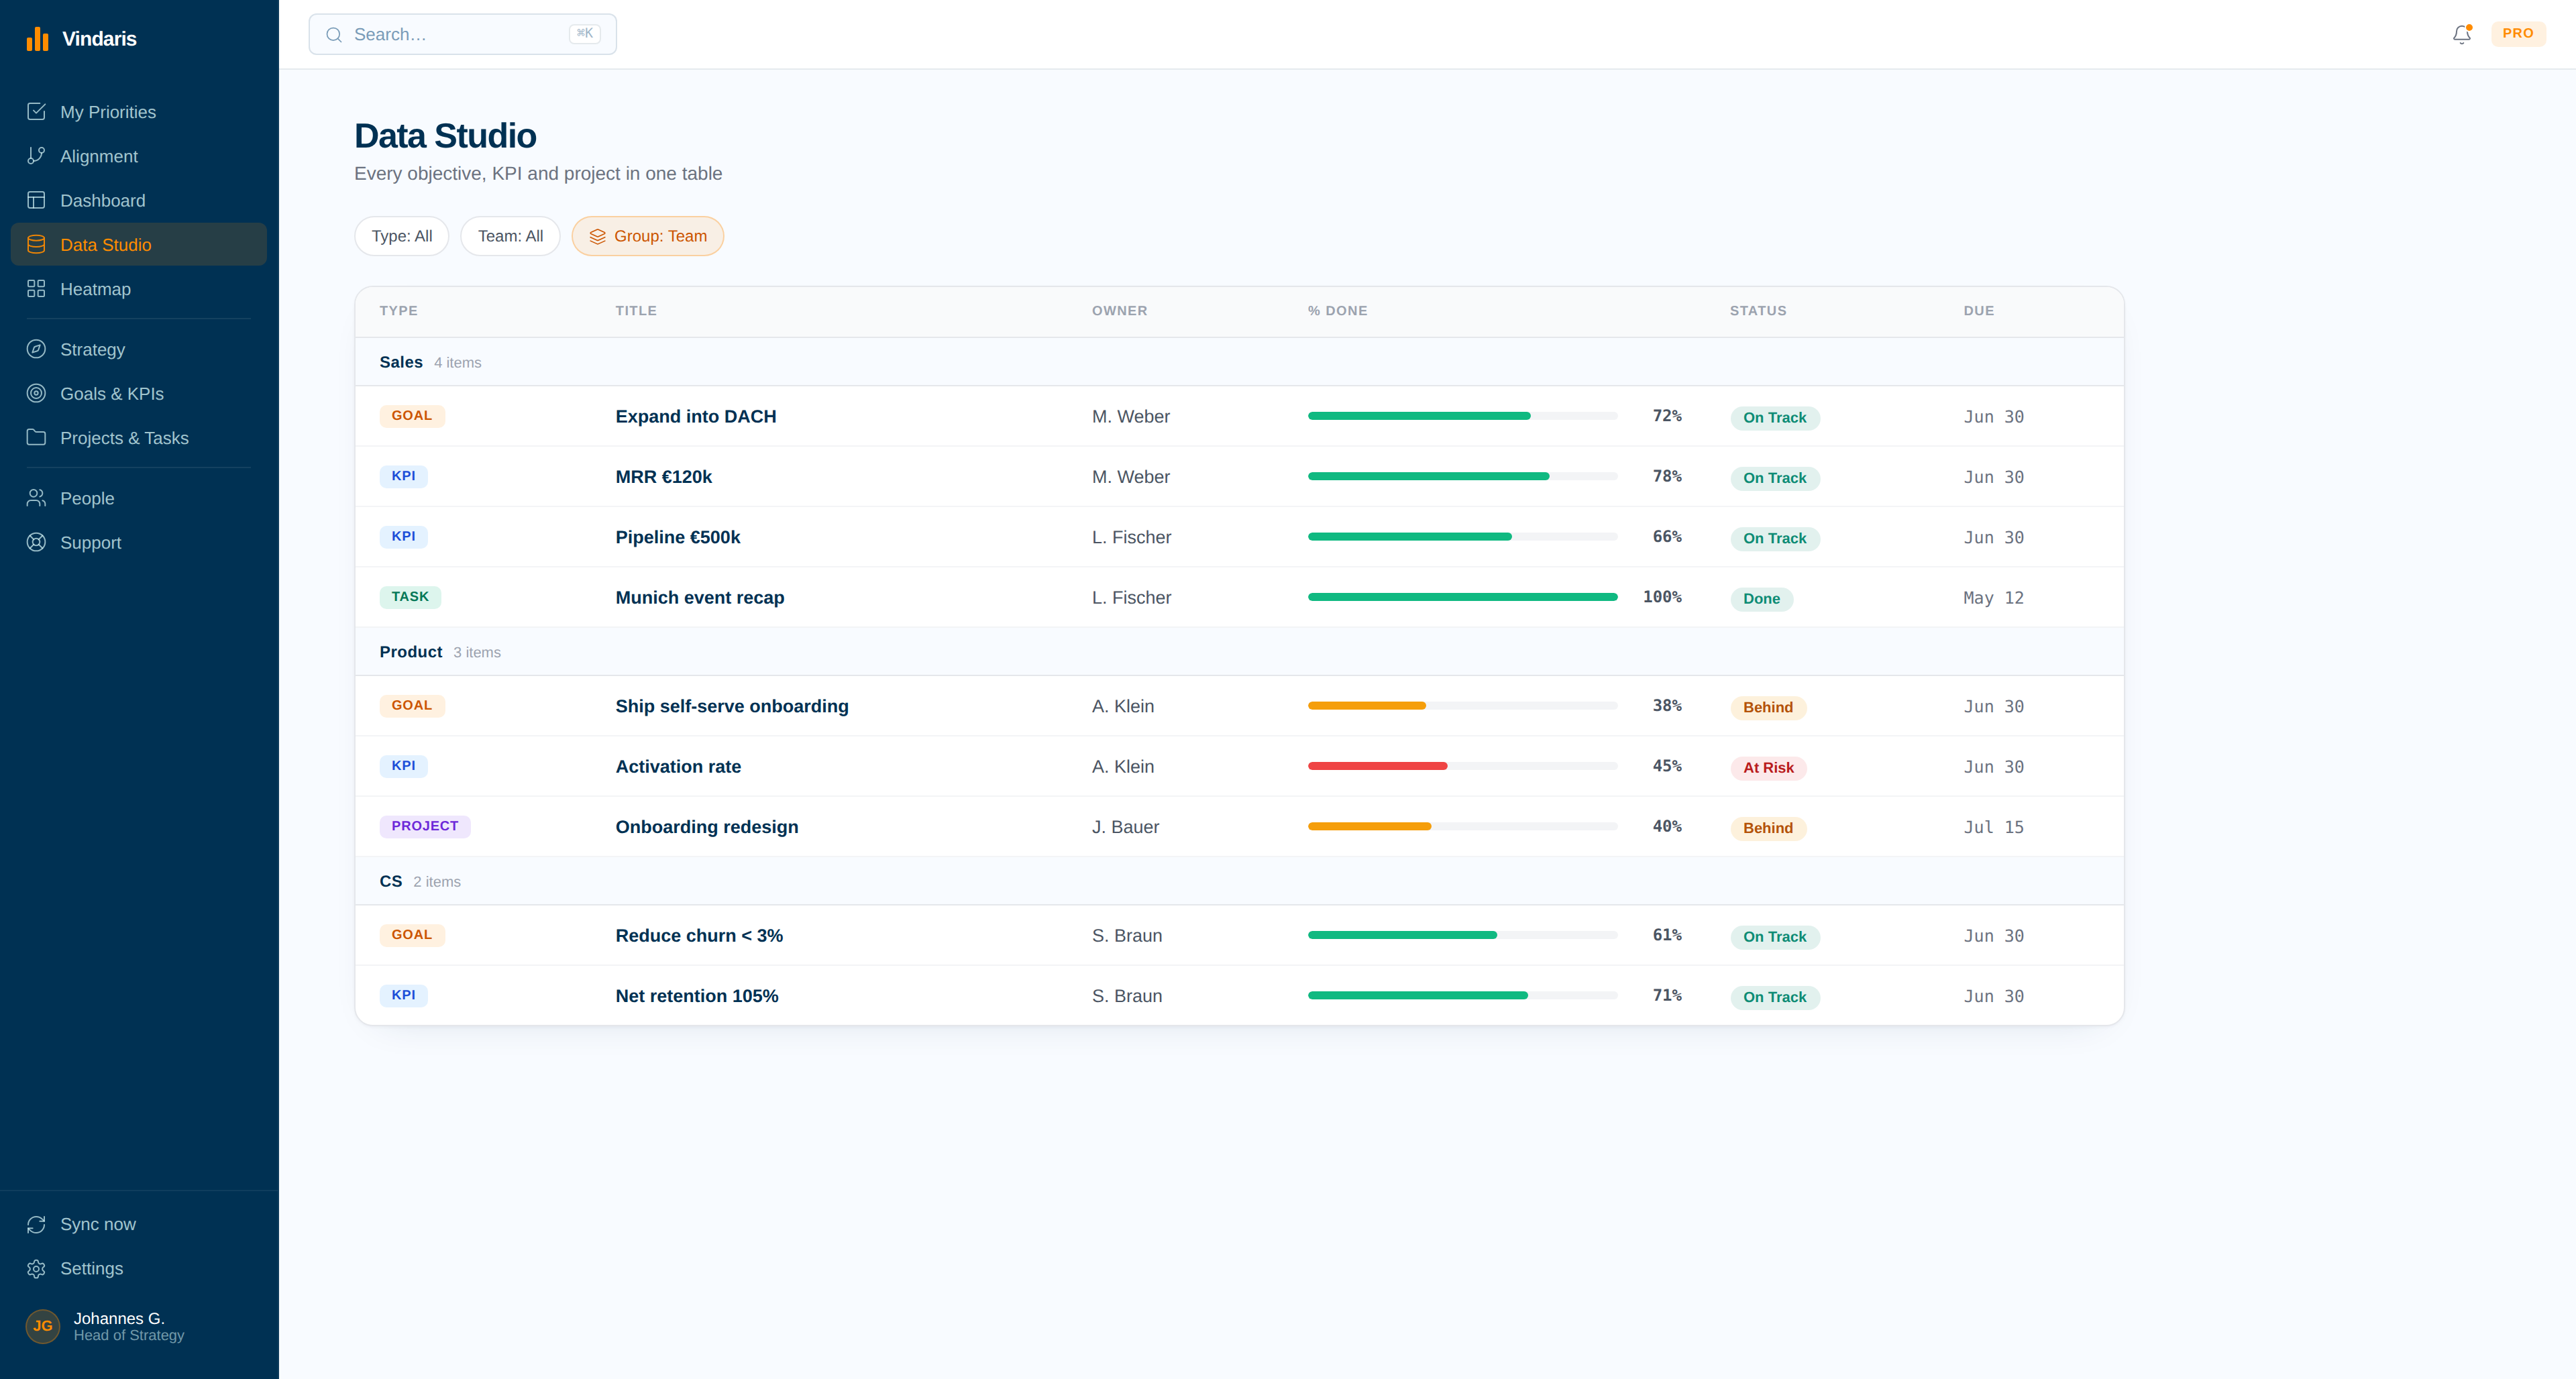
Filter every Goal, Strategy, Measure, project and task in one table, then save the view as a scheduled report. The monthly measure review starts from a query rather than from someone assembling the numbers.
- Save any filter as a view and have it delivered before the review.
- Compare Measures against the Strategies they belong to, not in isolation.
Connect the tools your Strategies run in
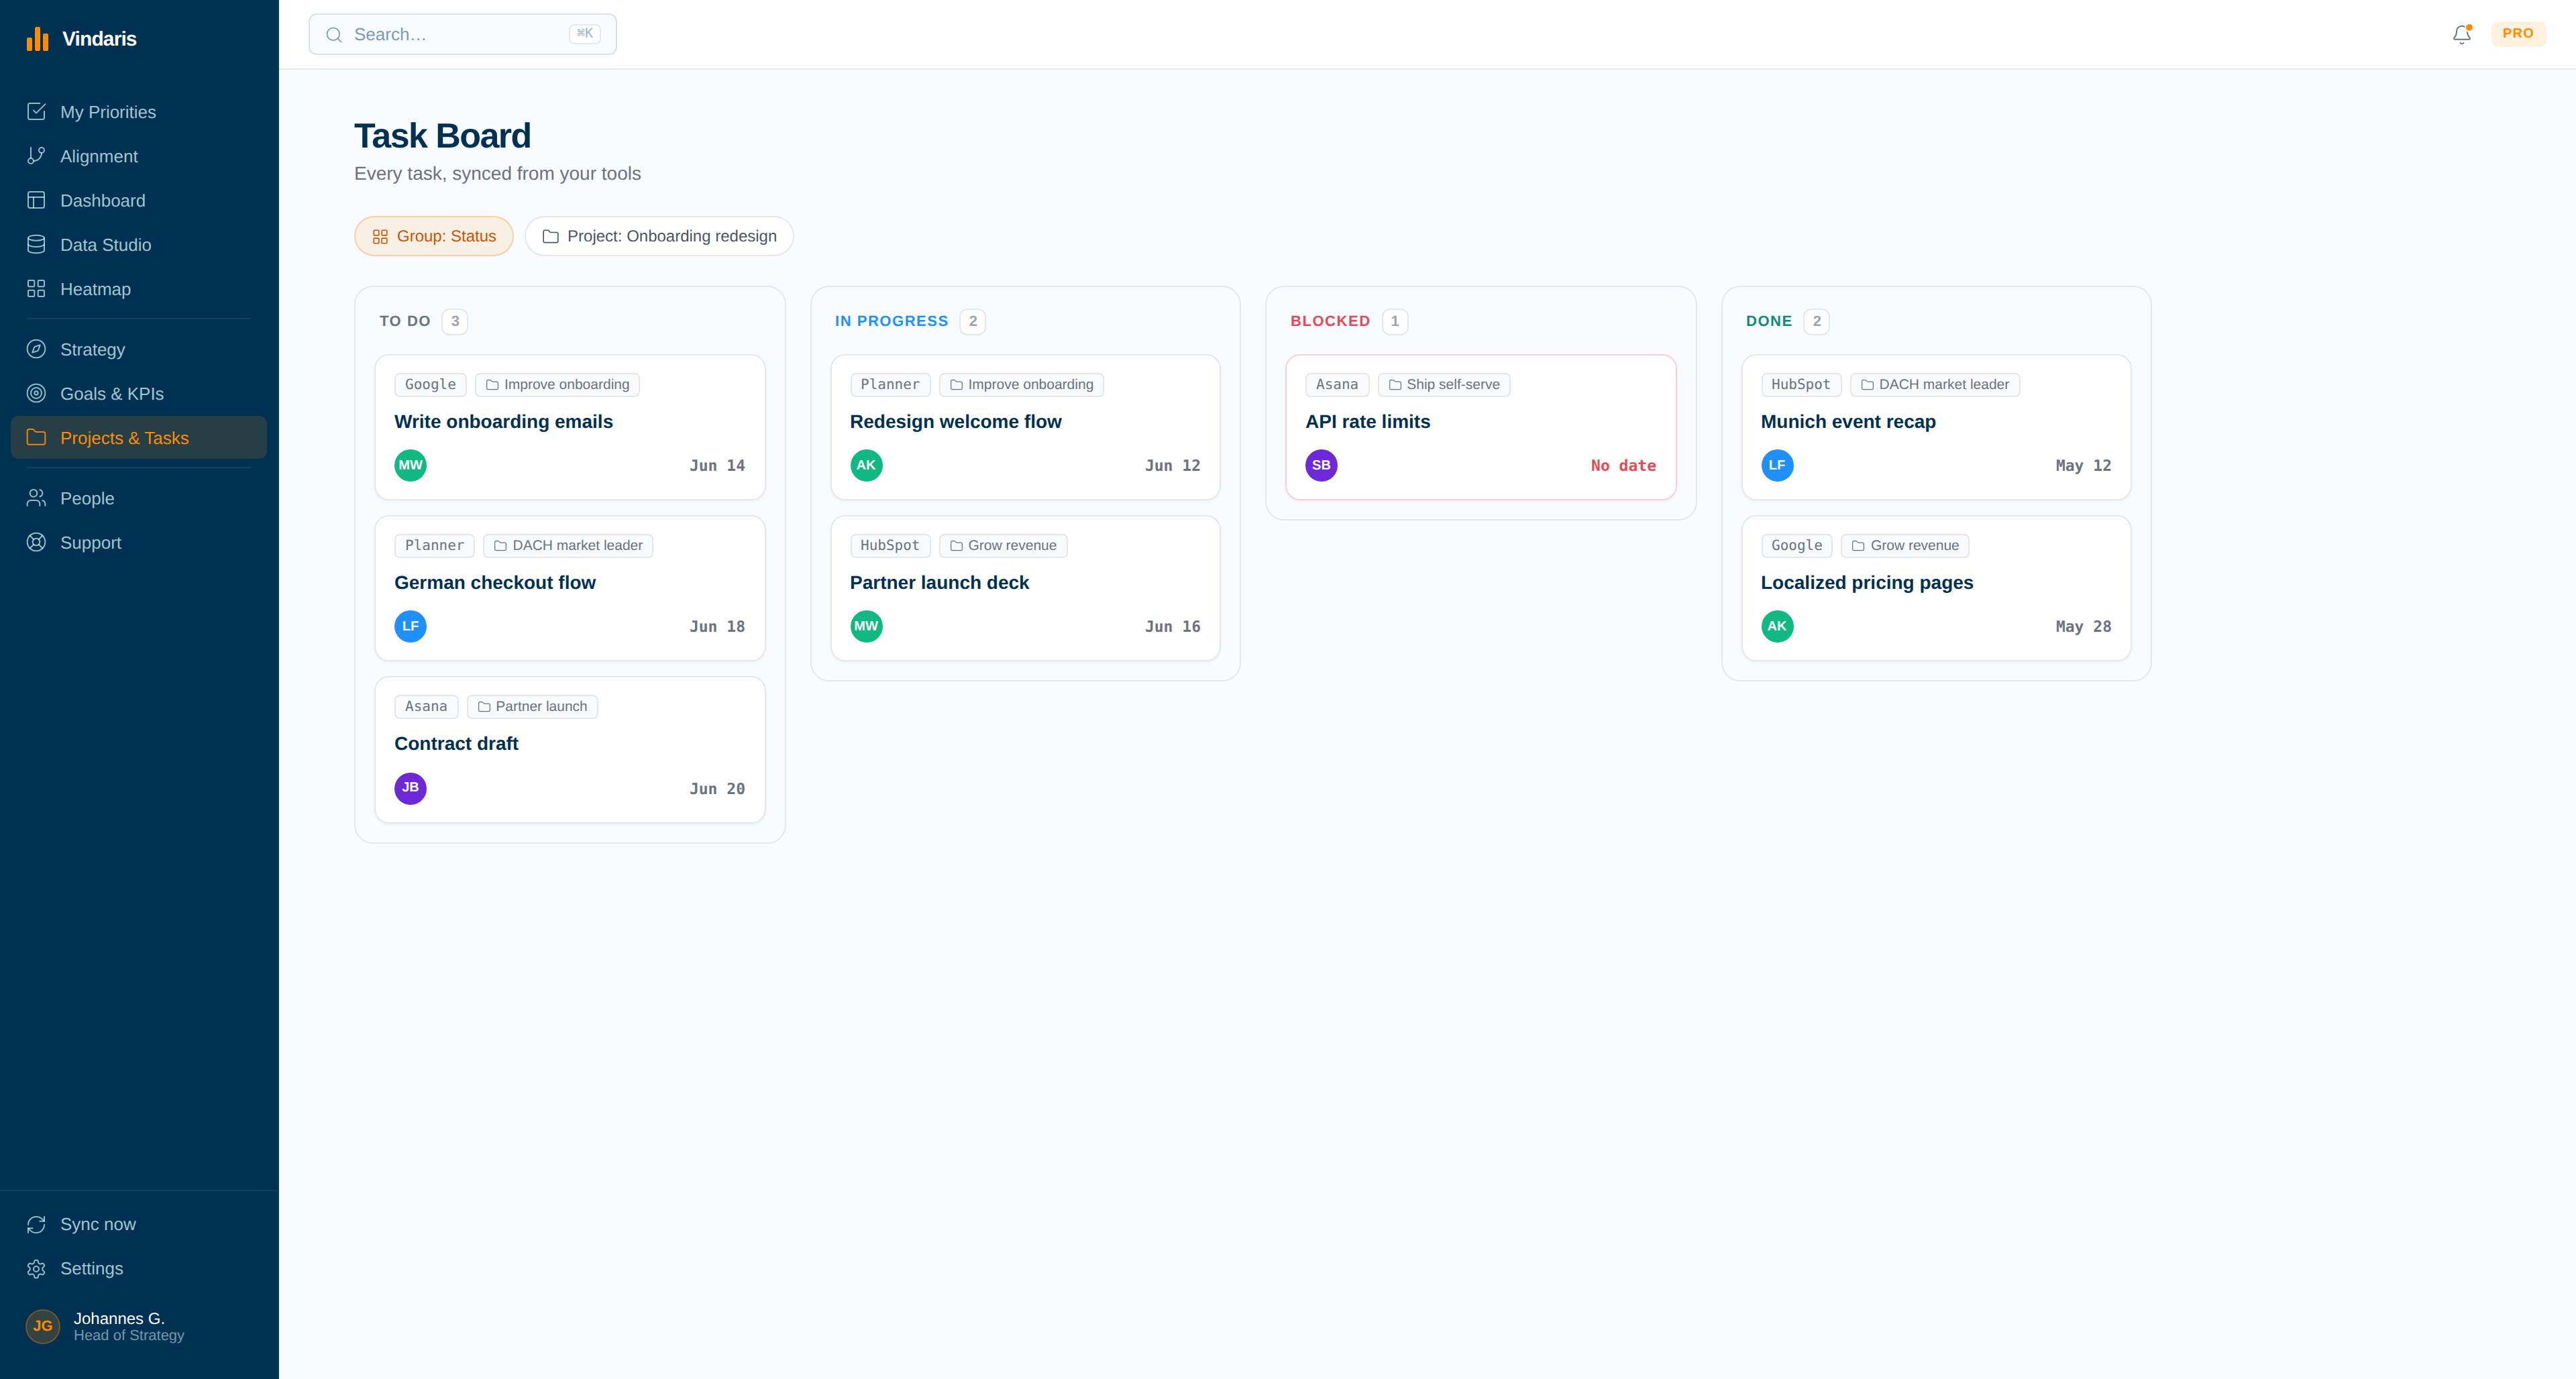
Plug in HubSpot, Microsoft Planner, Google Tasks, Asana or Jira. The Strategies on your one-pager gain the projects delivering them, so a Measure has something underneath it to explain a move.
- A task closed in Jira closes in Vindaris, and back again.
- Every synced item keeps a tag pointing at its source tool, so a Measure can be traced to its Strategy.
Get alerted when Strategies or Measures fall behind
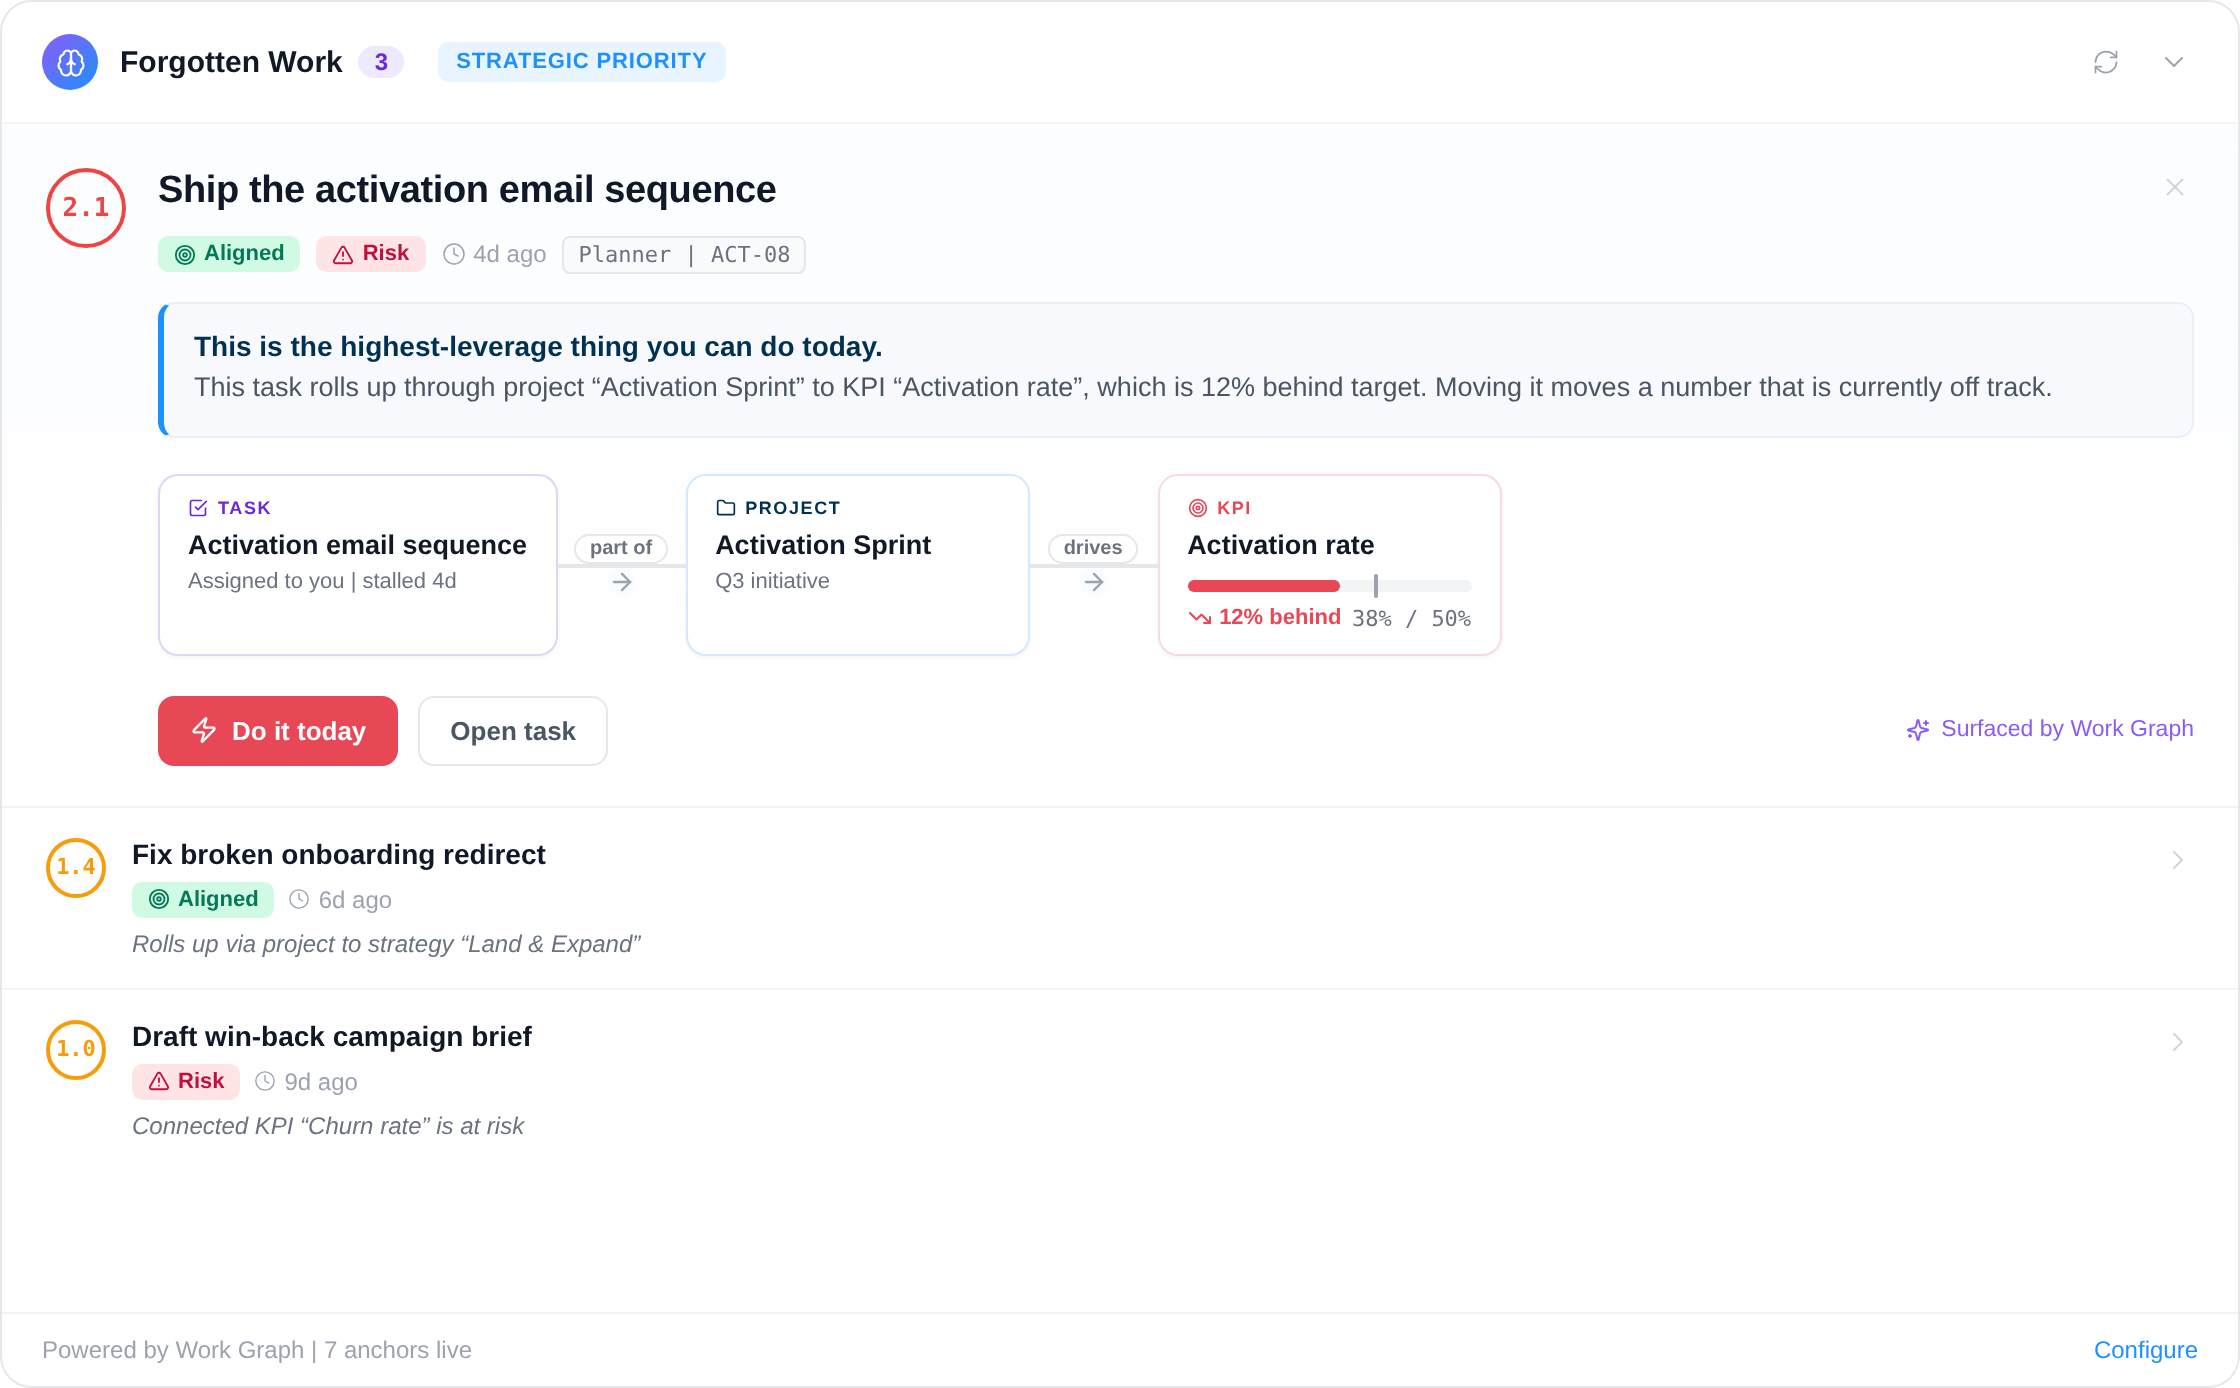
The Work Graph watches the projects under each Strategy and flags the moment their pace stops supporting the Measure above them, which is well before the monthly review would have caught it.
- A Strategy with no active work is flagged as a choice nobody acted on.
- Alerts name the Measure, the Strategy and the specific project.
One paragraph in, one page out.
OGSM is a page because a page forces a choice. Write the Objective, the Goals, the Strategies you picked and how you will know, tag them with @, and the hierarchy is drawn from the argument you just made.
Four of the twelve alerts, in OGSM terms.
The Work Graph reads the edges between the one-pager and the work delivering it. These four separate a Strategy that is failing from one that was never executed, which the page alone cannot do.
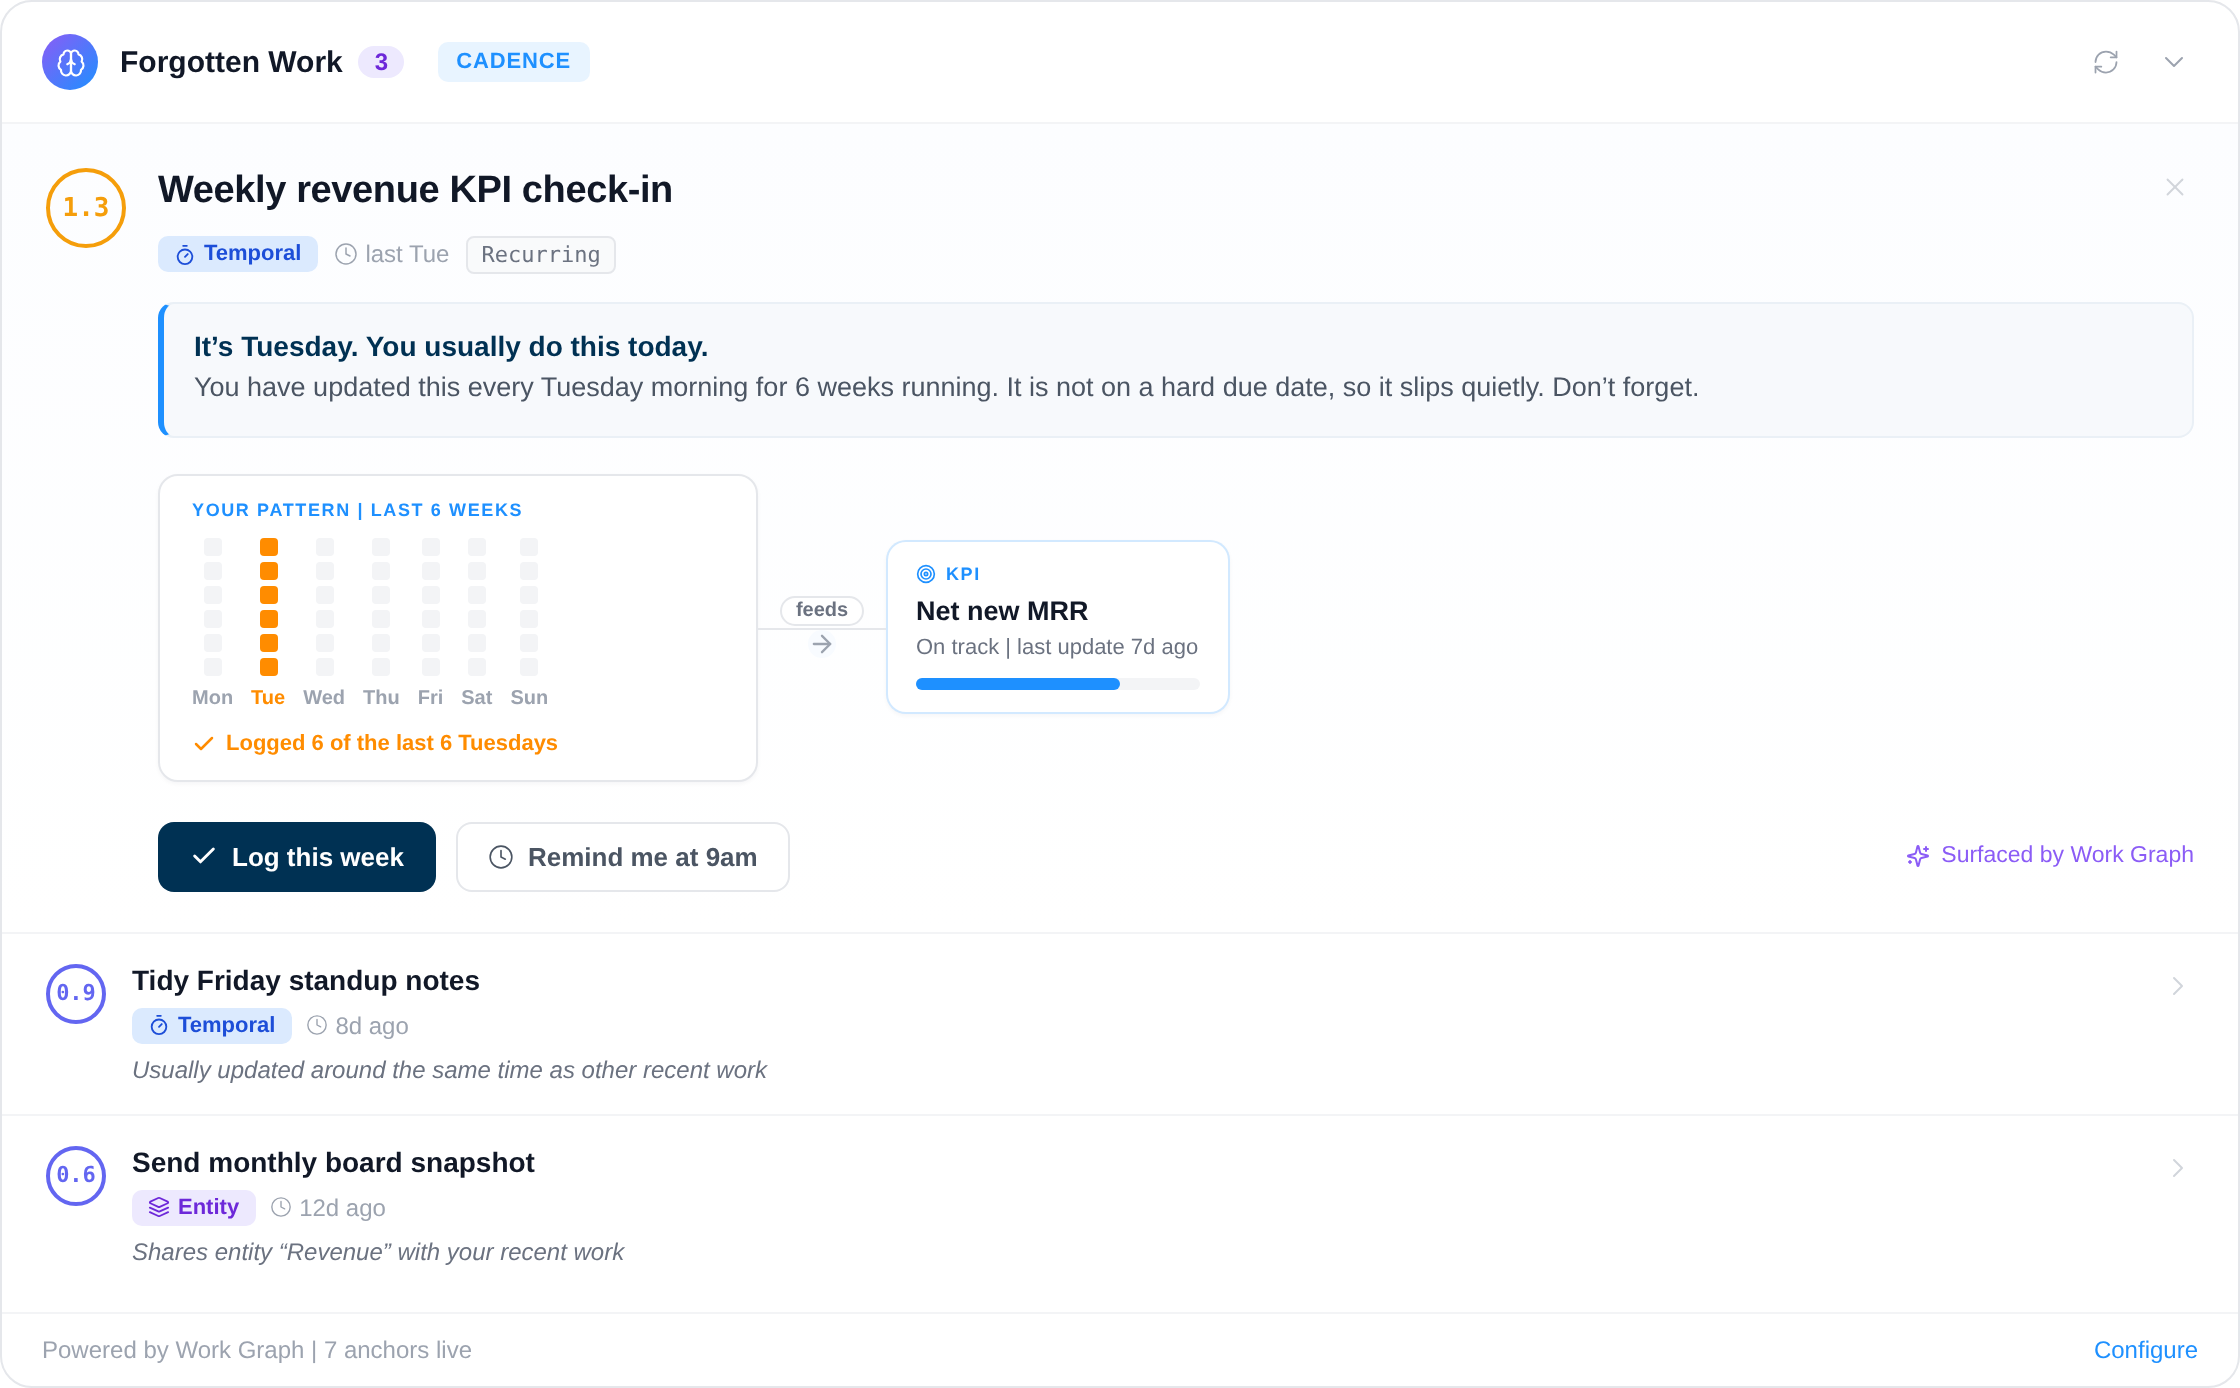
Twelve deterministic and AI-driven alerts watching for slipping work, broken routines and misaligned focus.
Your framework, your language, your data in Europe.
Vindaris keeps OGSM on one page where it belongs, and adds the layer underneath so a Measure can be traced to the Strategy and the work delivering it.
Runs OGSM without flattening it
Vindaris ships without a prescribed methodology, so Objectives, Goals, Strategies and Measures keep their names and their relationships. A Strategy can feed two Goals, and the same workspace can hold OGSM for the business while a department runs OKRs.
Free forever, including two integrations.
Free covers the whole OGSM structure and the work beneath it for up to 5 people. The one-pager does not become a paid feature at any tier.
Best for individual contributors, small teams or startups. No credit card required.
- All views: Canvas, My Priorities, Heatmap, Data Studio and Task Board
- Two integrations of your choice
- Up to four additional members
- Five ad-hoc AI risk summaries per month
Best for teams, small agencies, or departmental and team management.
- Everything in Free
- All integrations, unlimited sync
- Unlimited AI risk summaries and alignment suggestions
- Up to ten users in one organization
Best for multiple teams, exec teams, Chiefs of Staff or full-org deployments.
- Everything in Connect
- Unlimited users in one organization
- Direct human support, 24h response
- Human-led onboarding
The one-pager, before you commit to it.
Real Excel and PowerPoint files and browser tools that run without an account. The one-pager template is the fastest way to test whether OGSM fits your company.
Common questions, answered
What is OGSM software?
OGSM software helps organizations structure strategy using the Objective, Goals, Strategies, and Measures framework. Vindaris lets you build your OGSM on one page and connect each Strategy and Measure to the tasks and projects that deliver them.
How does OGSM differ from OKRs?
OGSM includes an explicit Strategies layer between objectives and measures, making it a good fit for companies that want to document how they will achieve goals, not just what they will measure. Vindaris supports both frameworks, so you can choose whichever fits your planning style.
Can Vindaris track OGSM and KPIs together?
Yes. Vindaris supports OGSM, OKRs, KPIs, Balanced Scorecard, and other frameworks side by side. You can track Measures from your OGSM alongside operational KPIs in the same workspace.
How does Vindaris connect OGSM to work execution?
Each Strategy and Measure in your OGSM links to real tasks in Jira, Microsoft Planner, Google Tasks, or HubSpot. Progress rolls up automatically, so leadership sees whether execution is on track without chasing status updates.
Know which Measures will miss while the plan can still change.
Connect your first tool in 90 seconds. Free forever for OGSM management.
Start your OGSM freeNo credit card | No migration | No minimum contract
Last reviewed August 2026