Customers
See where your KPIs slip before the quarter does
1000 Good Things, Kith Spark, and rufmacher connect their goals to the work behind them in Vindaris. Read how each team caught drift early and retired the reports they used to build by hand.
 1000Good Things
Case study →
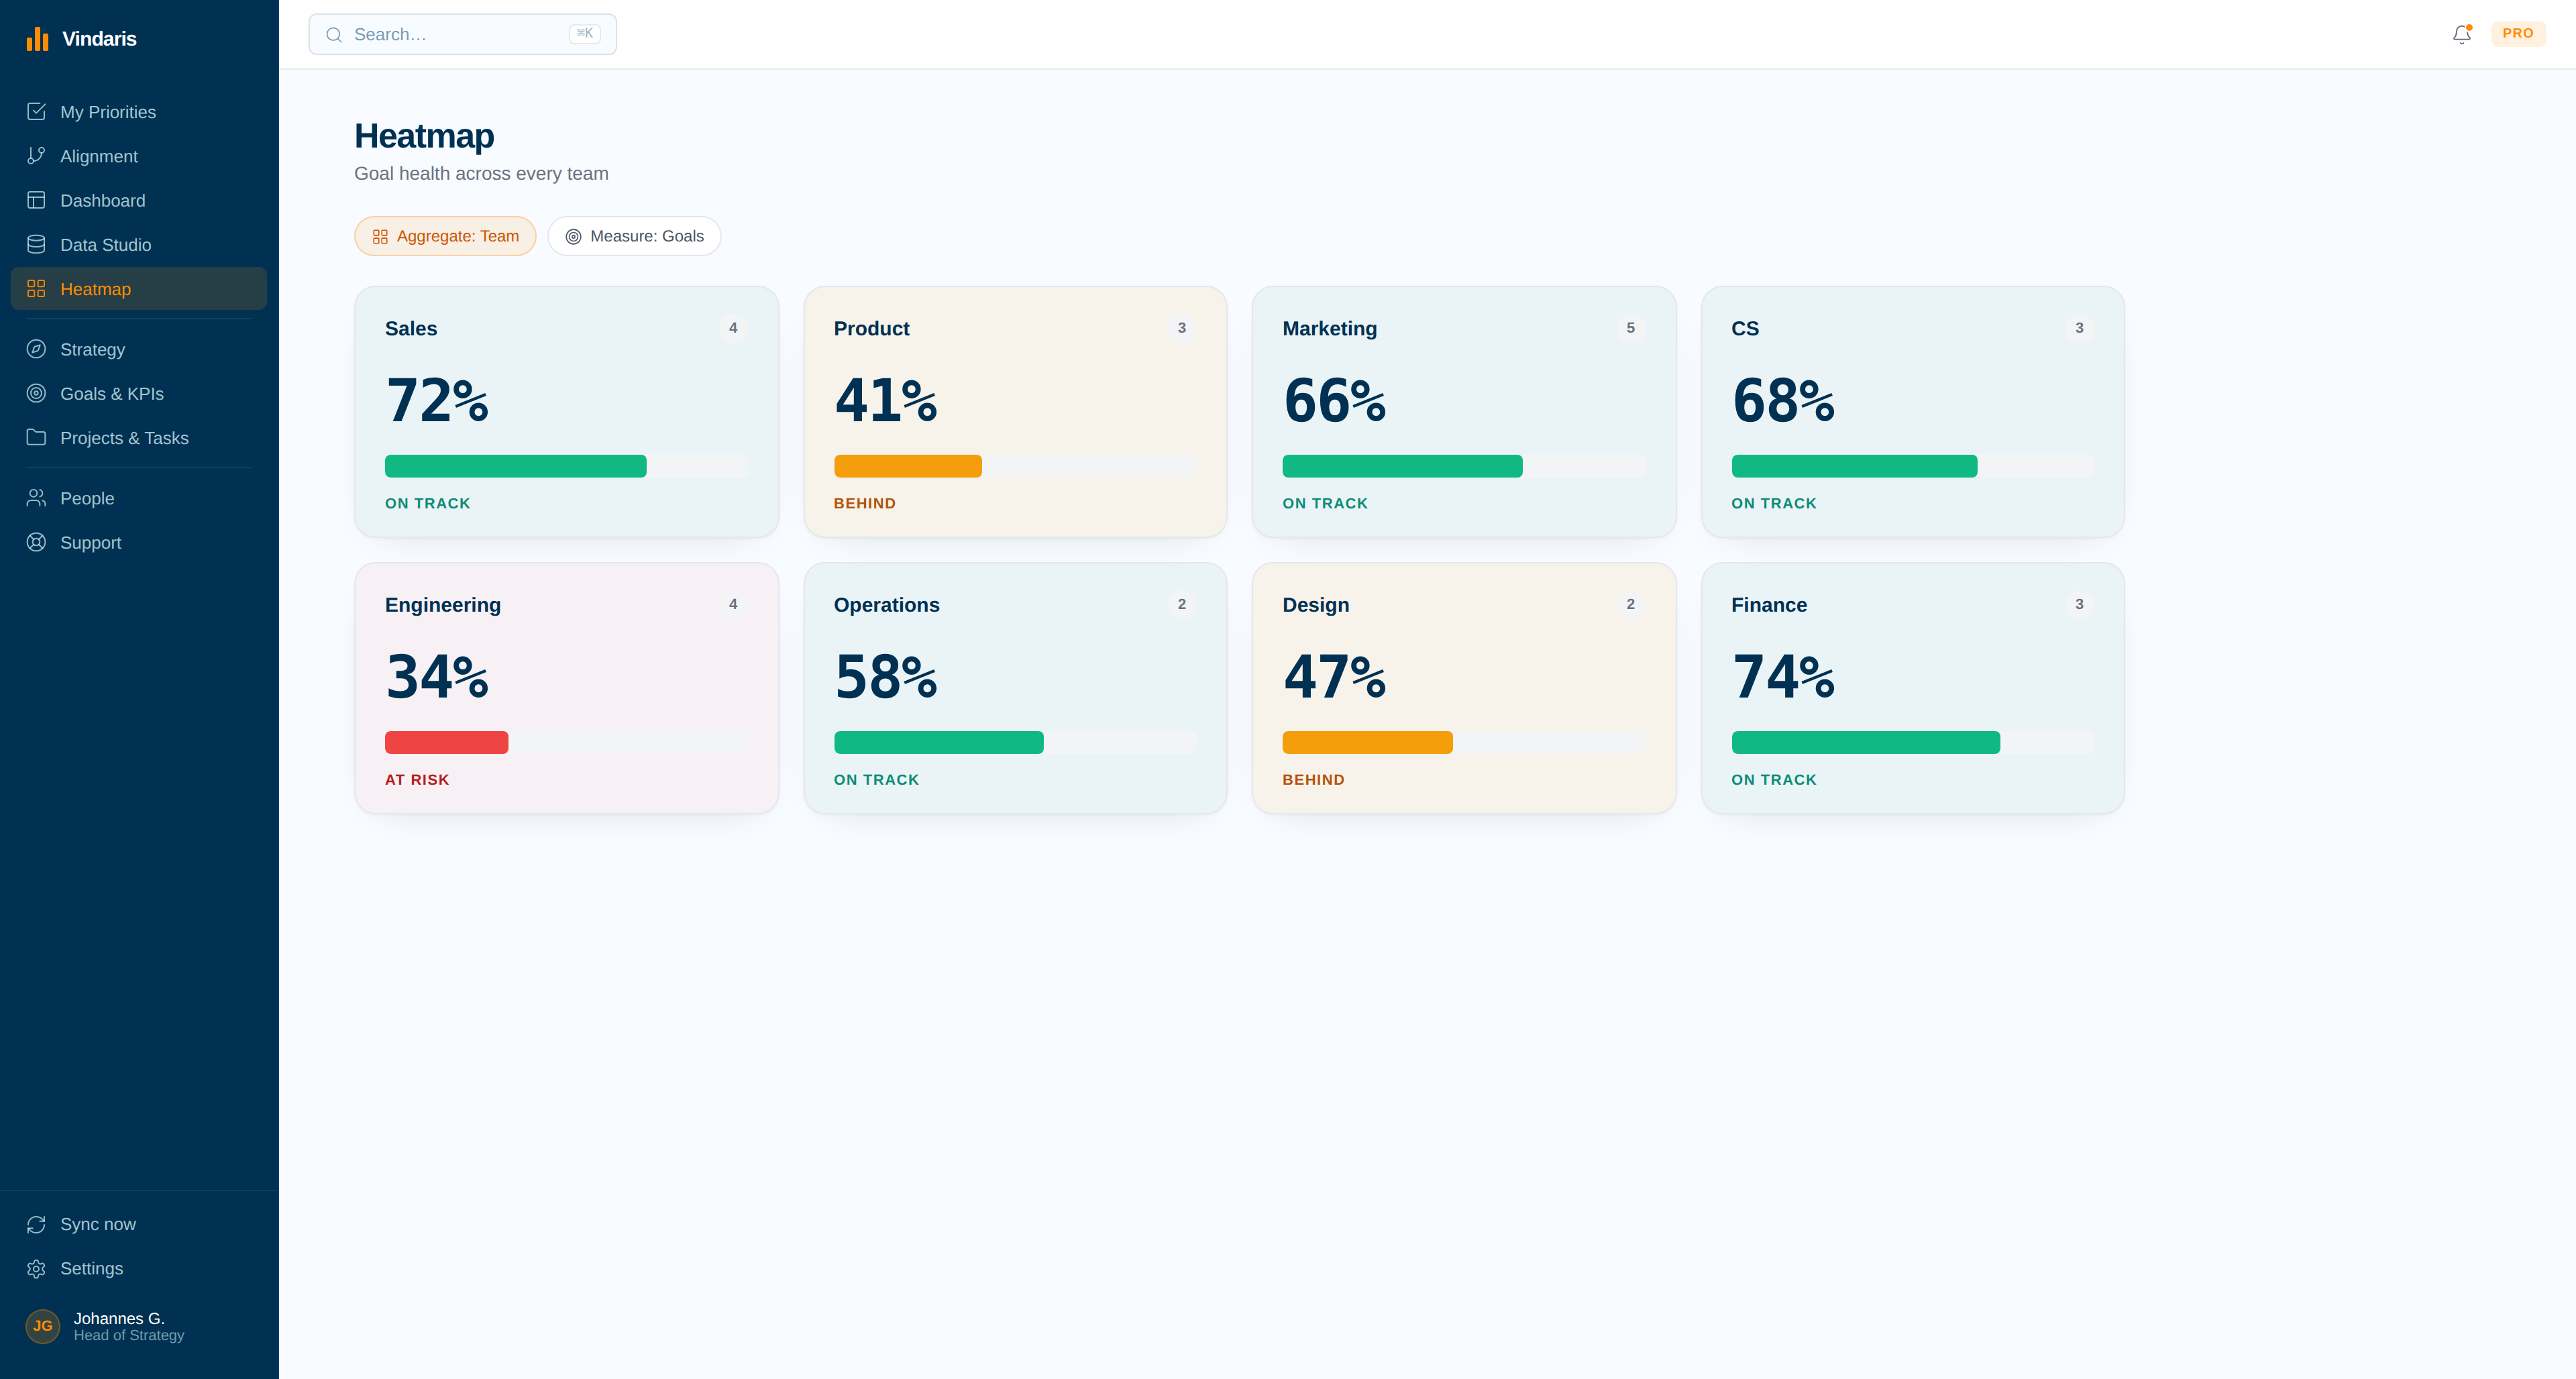
“The heatmap tells us which KPI is short on activity before the team does.”
1000Good Things
Case study →
“The heatmap tells us which KPI is short on activity before the team does.”
 Kith Spark
Case study →
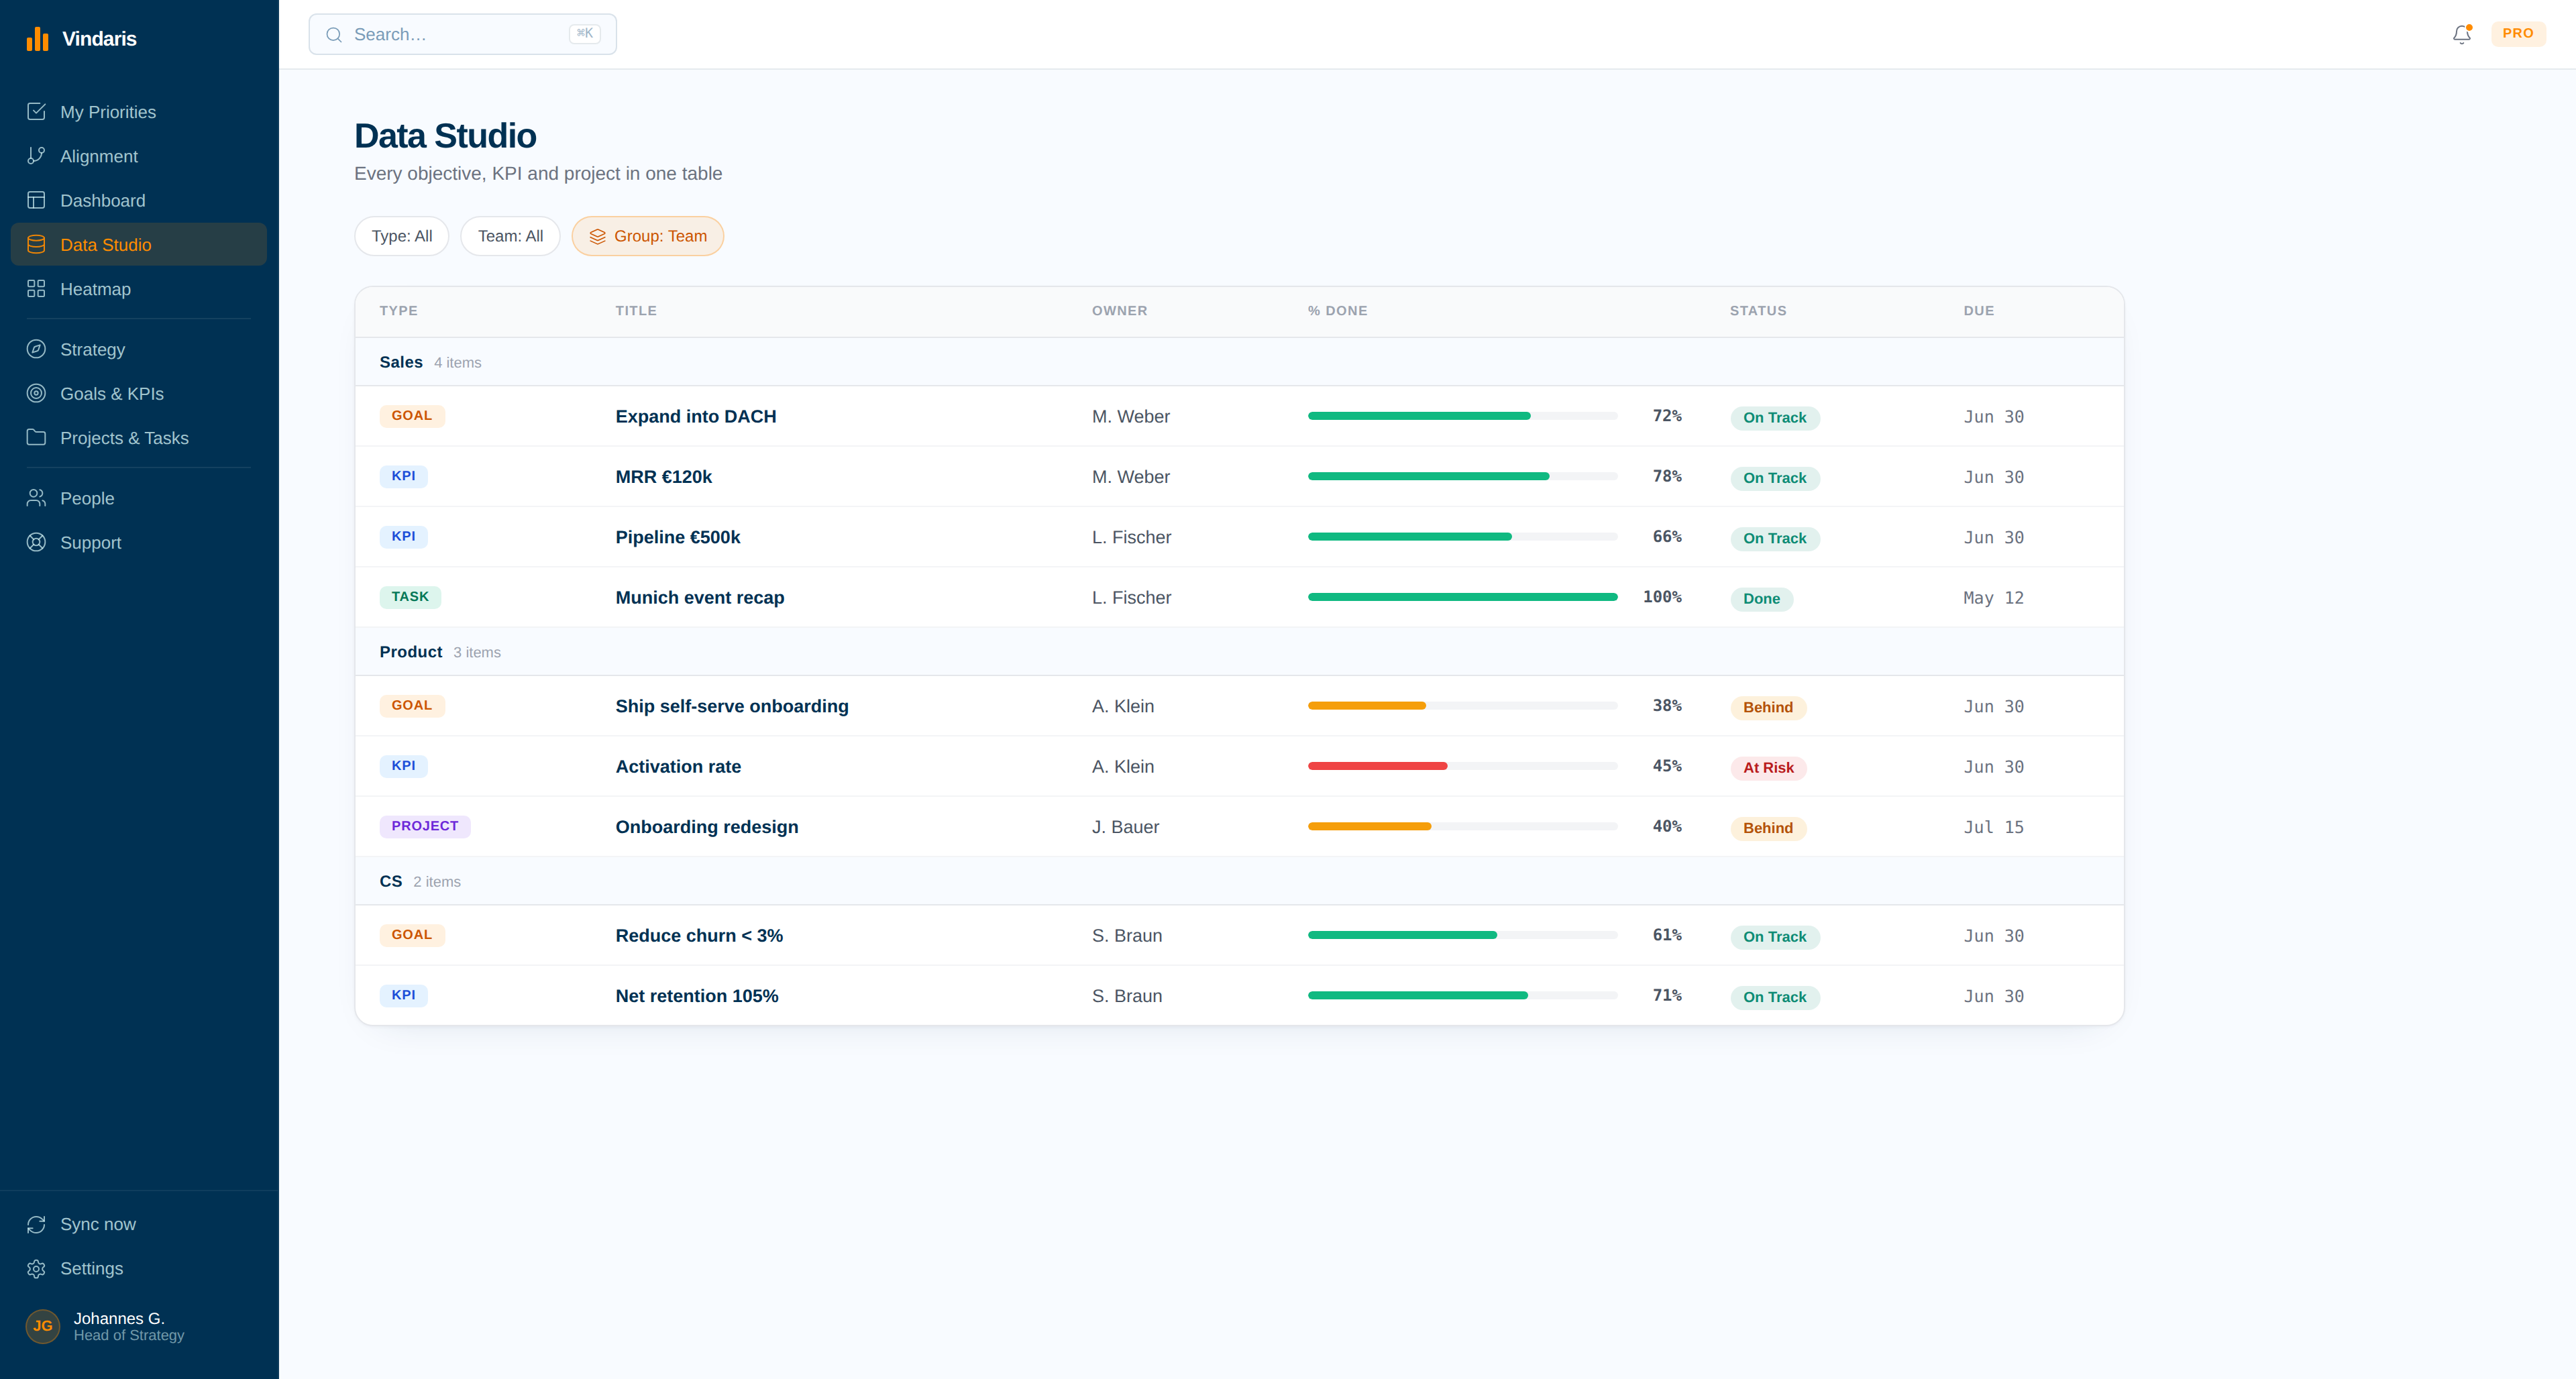
“The dashboard shows exactly where we're ahead and where we need to lean in.”
Kith Spark
Case study →
“The dashboard shows exactly where we're ahead and where we need to lean in.”
 Case study →
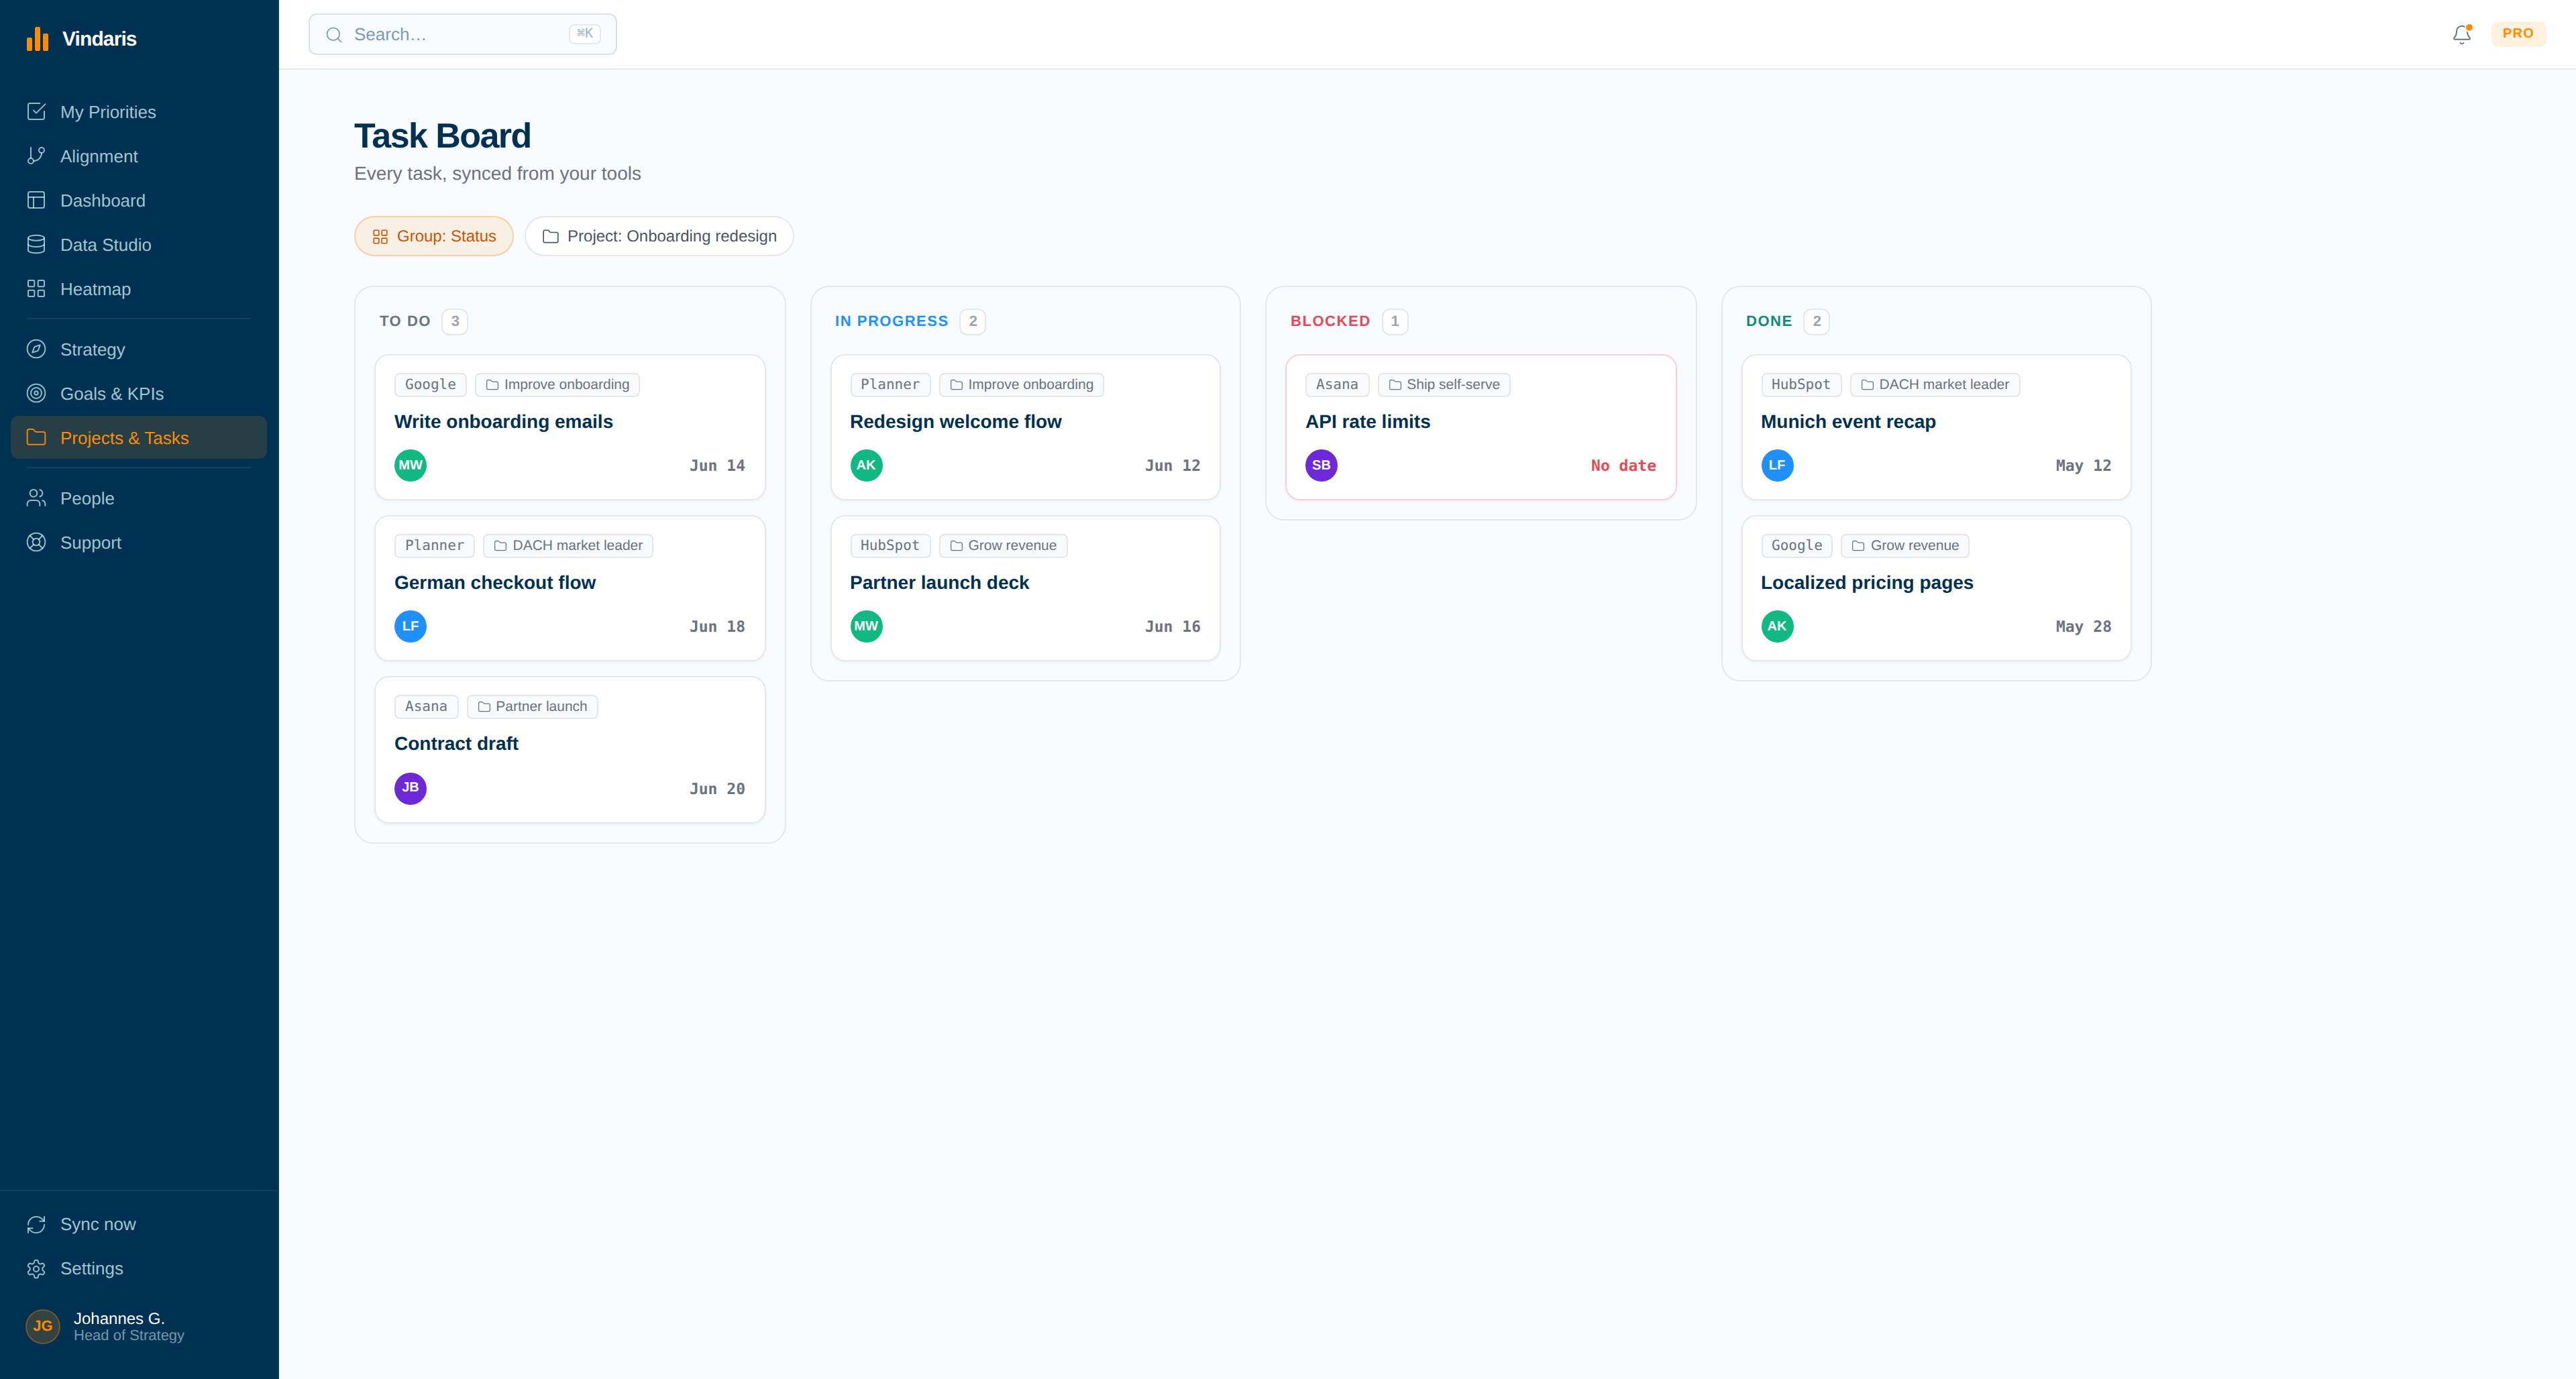
“The Work Graph compared our reps' patterns and flagged the step everyone but the top performers skipped.”
Case study →
“The Work Graph compared our reps' patterns and flagged the step everyone but the top performers skipped.”
Try Vindaris free
Your team could be the next case study
Connect your goals to the work that proves them. Start free, no credit card required.
Sign Up for Free