Hoshin Kanri with the cascade connected to real work.
Vindaris links breakthrough objectives, annual objectives and improvement priorities to the tasks executing them, so catchball produces commitments the system can actually track.





What is Hoshin Kanri?
Hoshin Kanri is a strategy deployment method built around a small number of breakthrough objectives, an X-matrix that connects them to annual objectives, improvement priorities and metrics, and catchball, the negotiation that pushes each level down through the organization. It is the most rigorous framework in common use and the least forgiving of stale data.
What is the X-matrix for?
It forces every element of the plan to declare its relationships: which annual objective serves which breakthrough, which improvement priority serves which objective, which metric proves it. The matrix is valuable precisely because filling it in honestly exposes the priorities that connect to nothing.
What are the four sections of the X-matrix?
Read clockwise from the bottom: breakthrough objectives (3-5 years), annual objectives (this year's slice), top-level improvement priorities (the initiatives), and targets to improve (the metrics). Owners attach to the priorities, and correlation marks link each layer to the next. A free X-matrix template with all four sections and a catchball log is in the templates library.
How does catchball actually work?
Each level proposes how it will contribute, the level above responds, and the two iterate until both commit. It is slower than cascading and considerably more durable, because the team that has to deliver has argued about the target rather than received it.
Why does Hoshin Kanri fail in practice?
Almost always for the same reason: the matrix is built in a planning cycle and then never reflects reality again. An X-matrix is a set of claimed relationships, and if nothing checks whether the improvement work is moving, the matrix stays green while the deployment quietly stops.
Can Hoshin run alongside OKRs?
Yes, and in large organizations it usually has to. Hoshin tends to live at corporate and manufacturing level while product and commercial teams run OKRs. Vindaris holds both natively, so the breakthrough objectives can read progress from teams that never touch the X-matrix.
 Click thru live demo
Pre-built workspace. No signup.
Click thru live demo
Pre-built workspace. No signup.
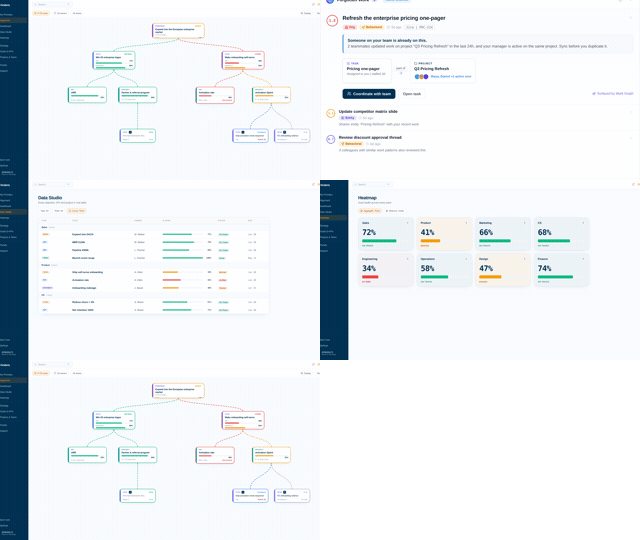
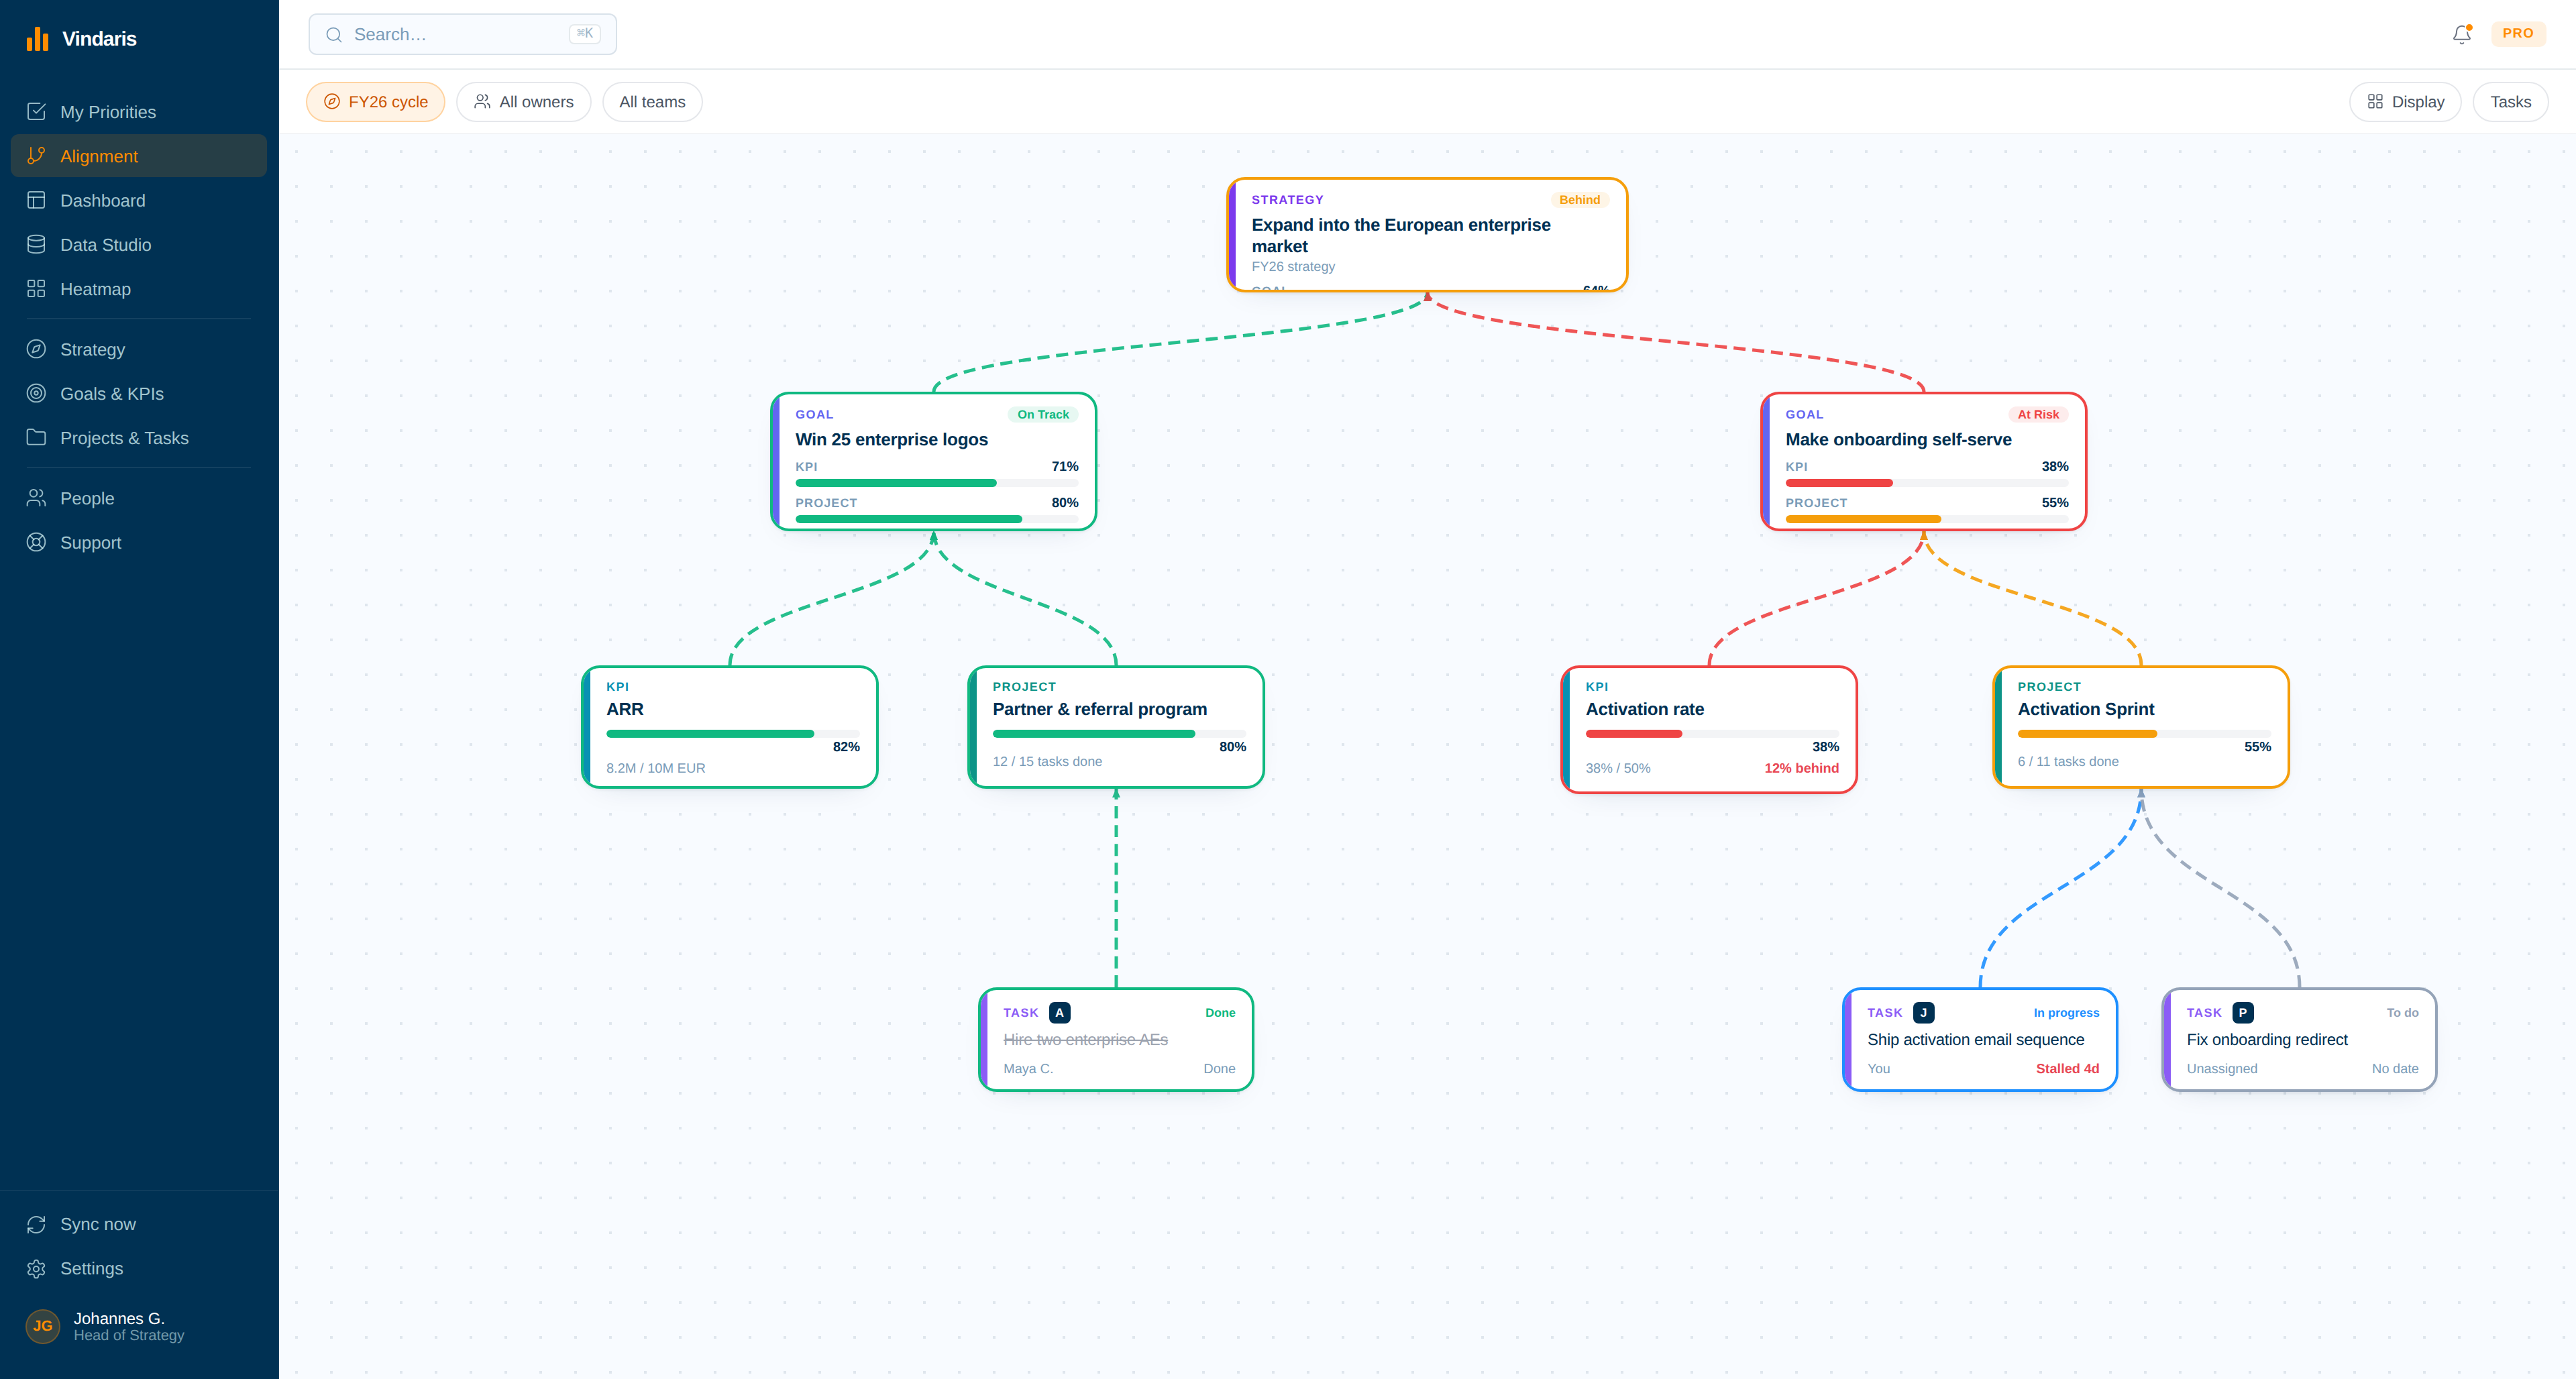
The Hoshin cascade on one board: breakthrough objectives at the top, annual objectives and improvement priorities beneath, and the work each level actually depends on. Click through the live workspace, no signup.
Start with the matrix on a page.
Hoshin is rigorous on paper and fragile in practice, and it breaks in the same three places every year: the handoff between levels, the day job, and the review that comes too late.
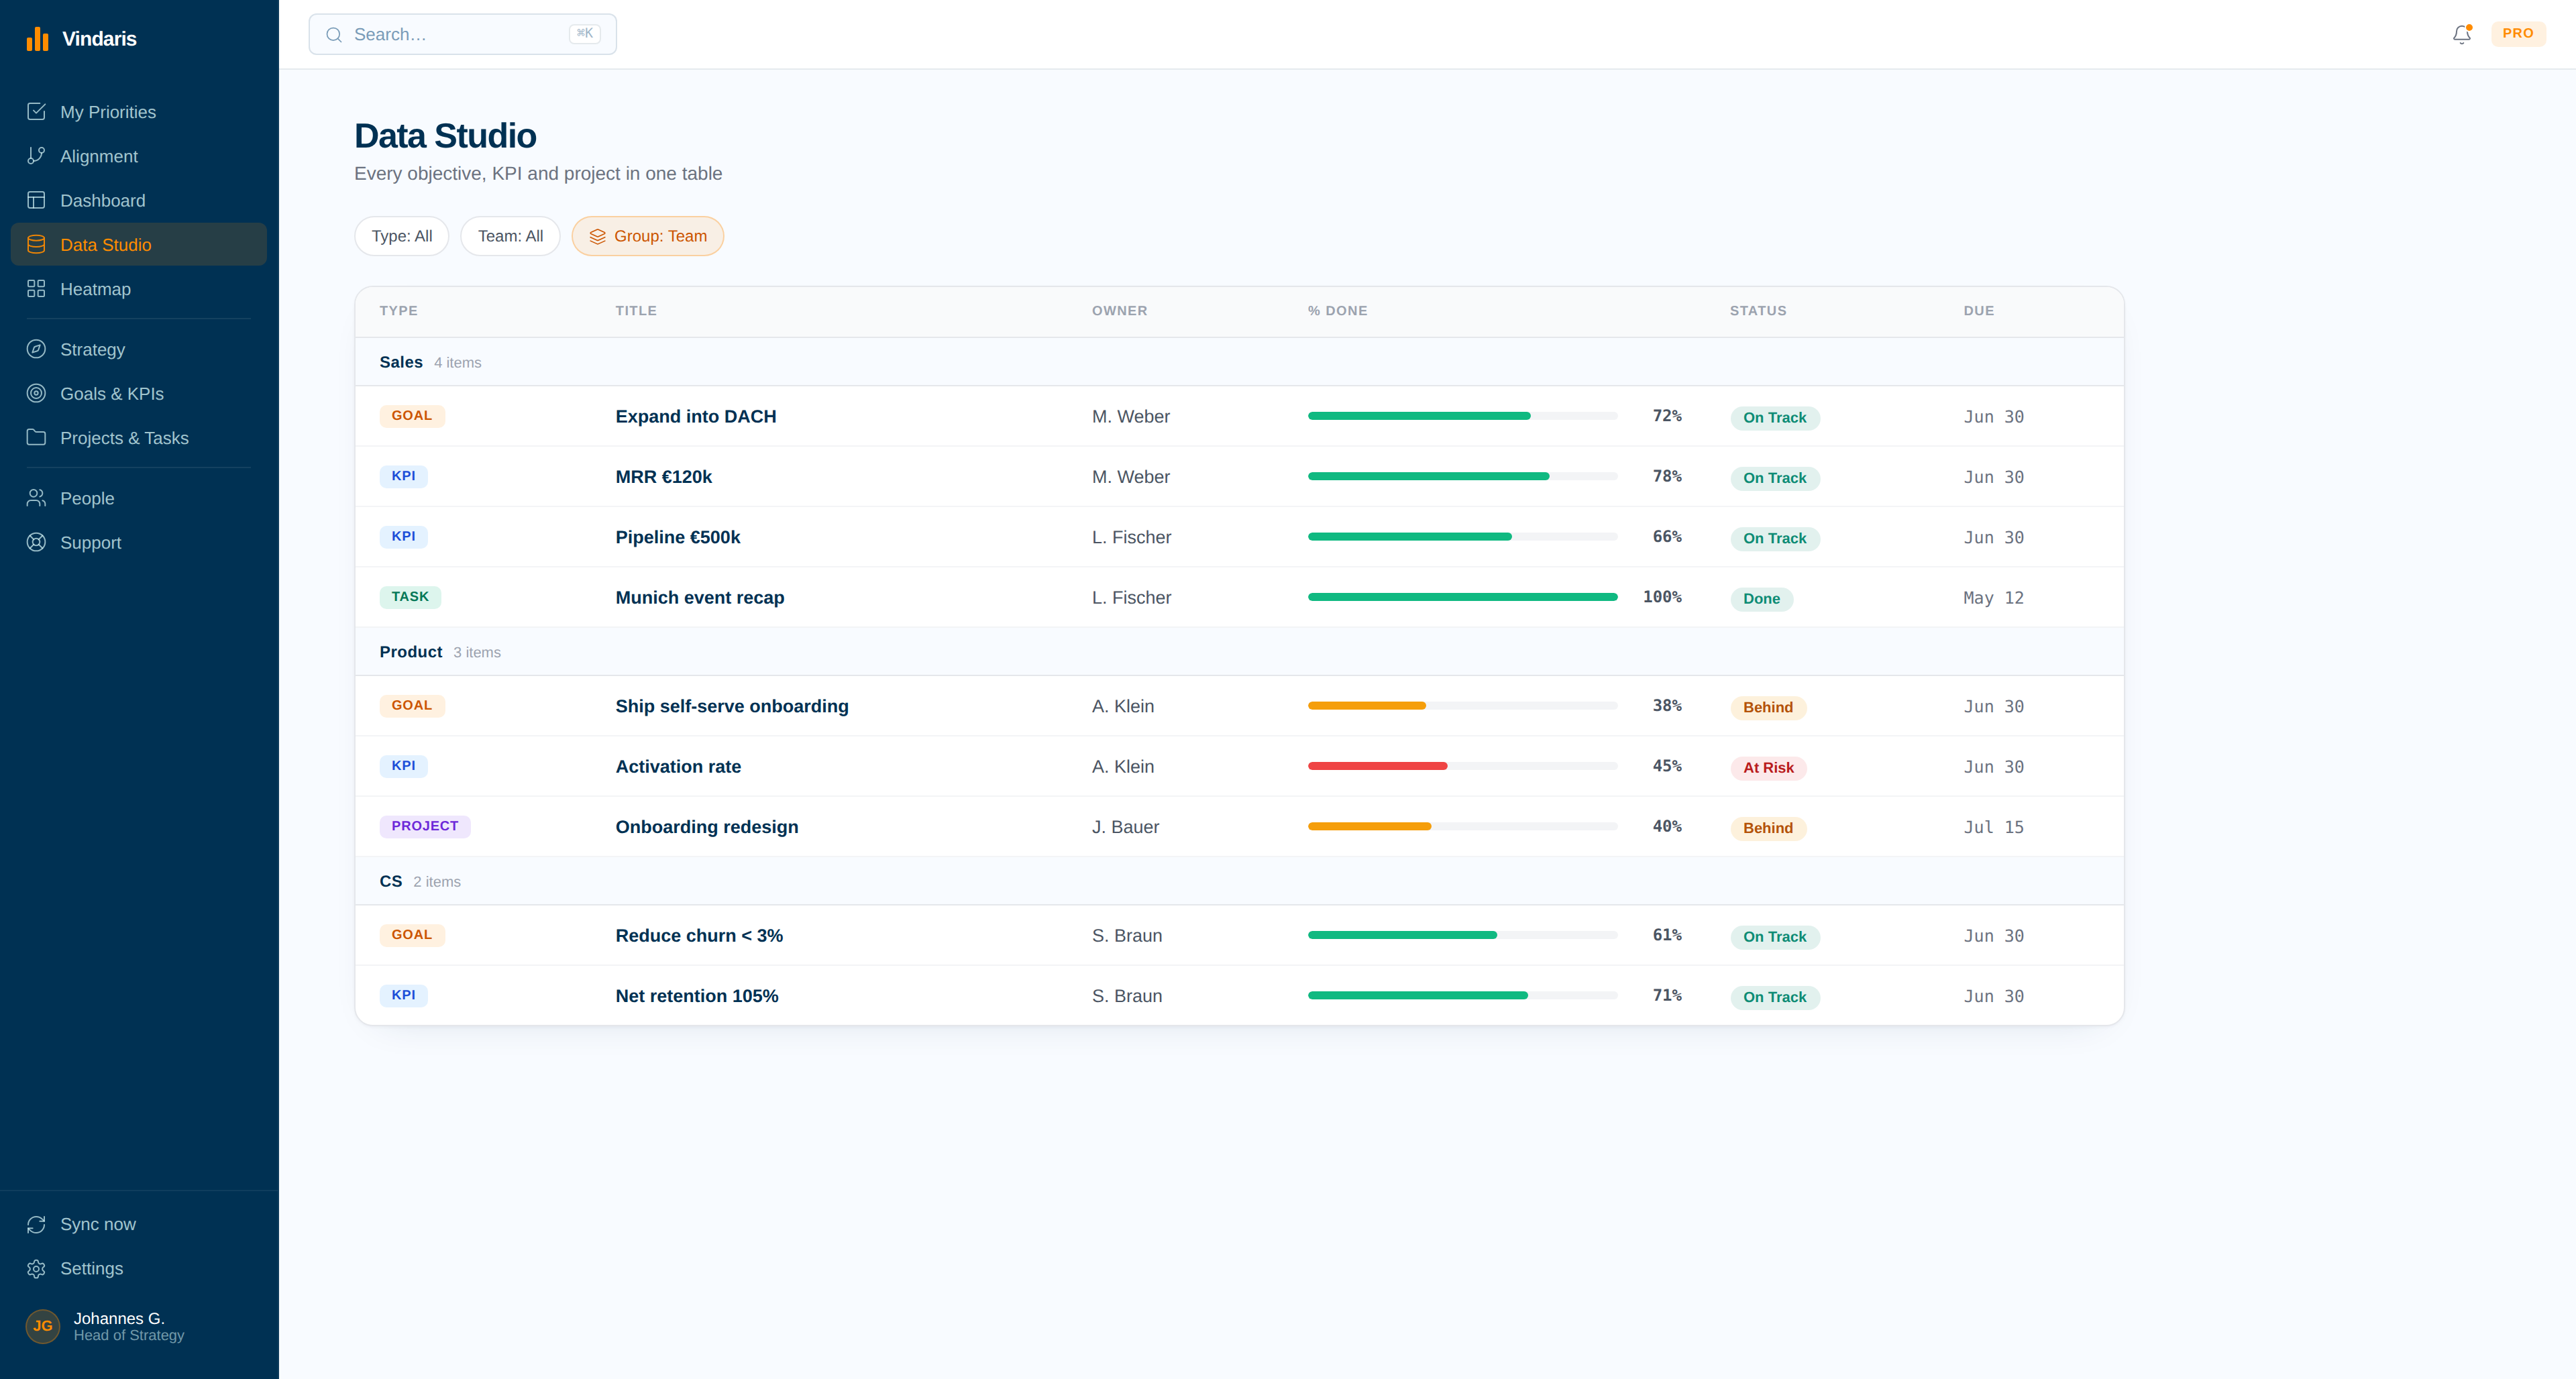
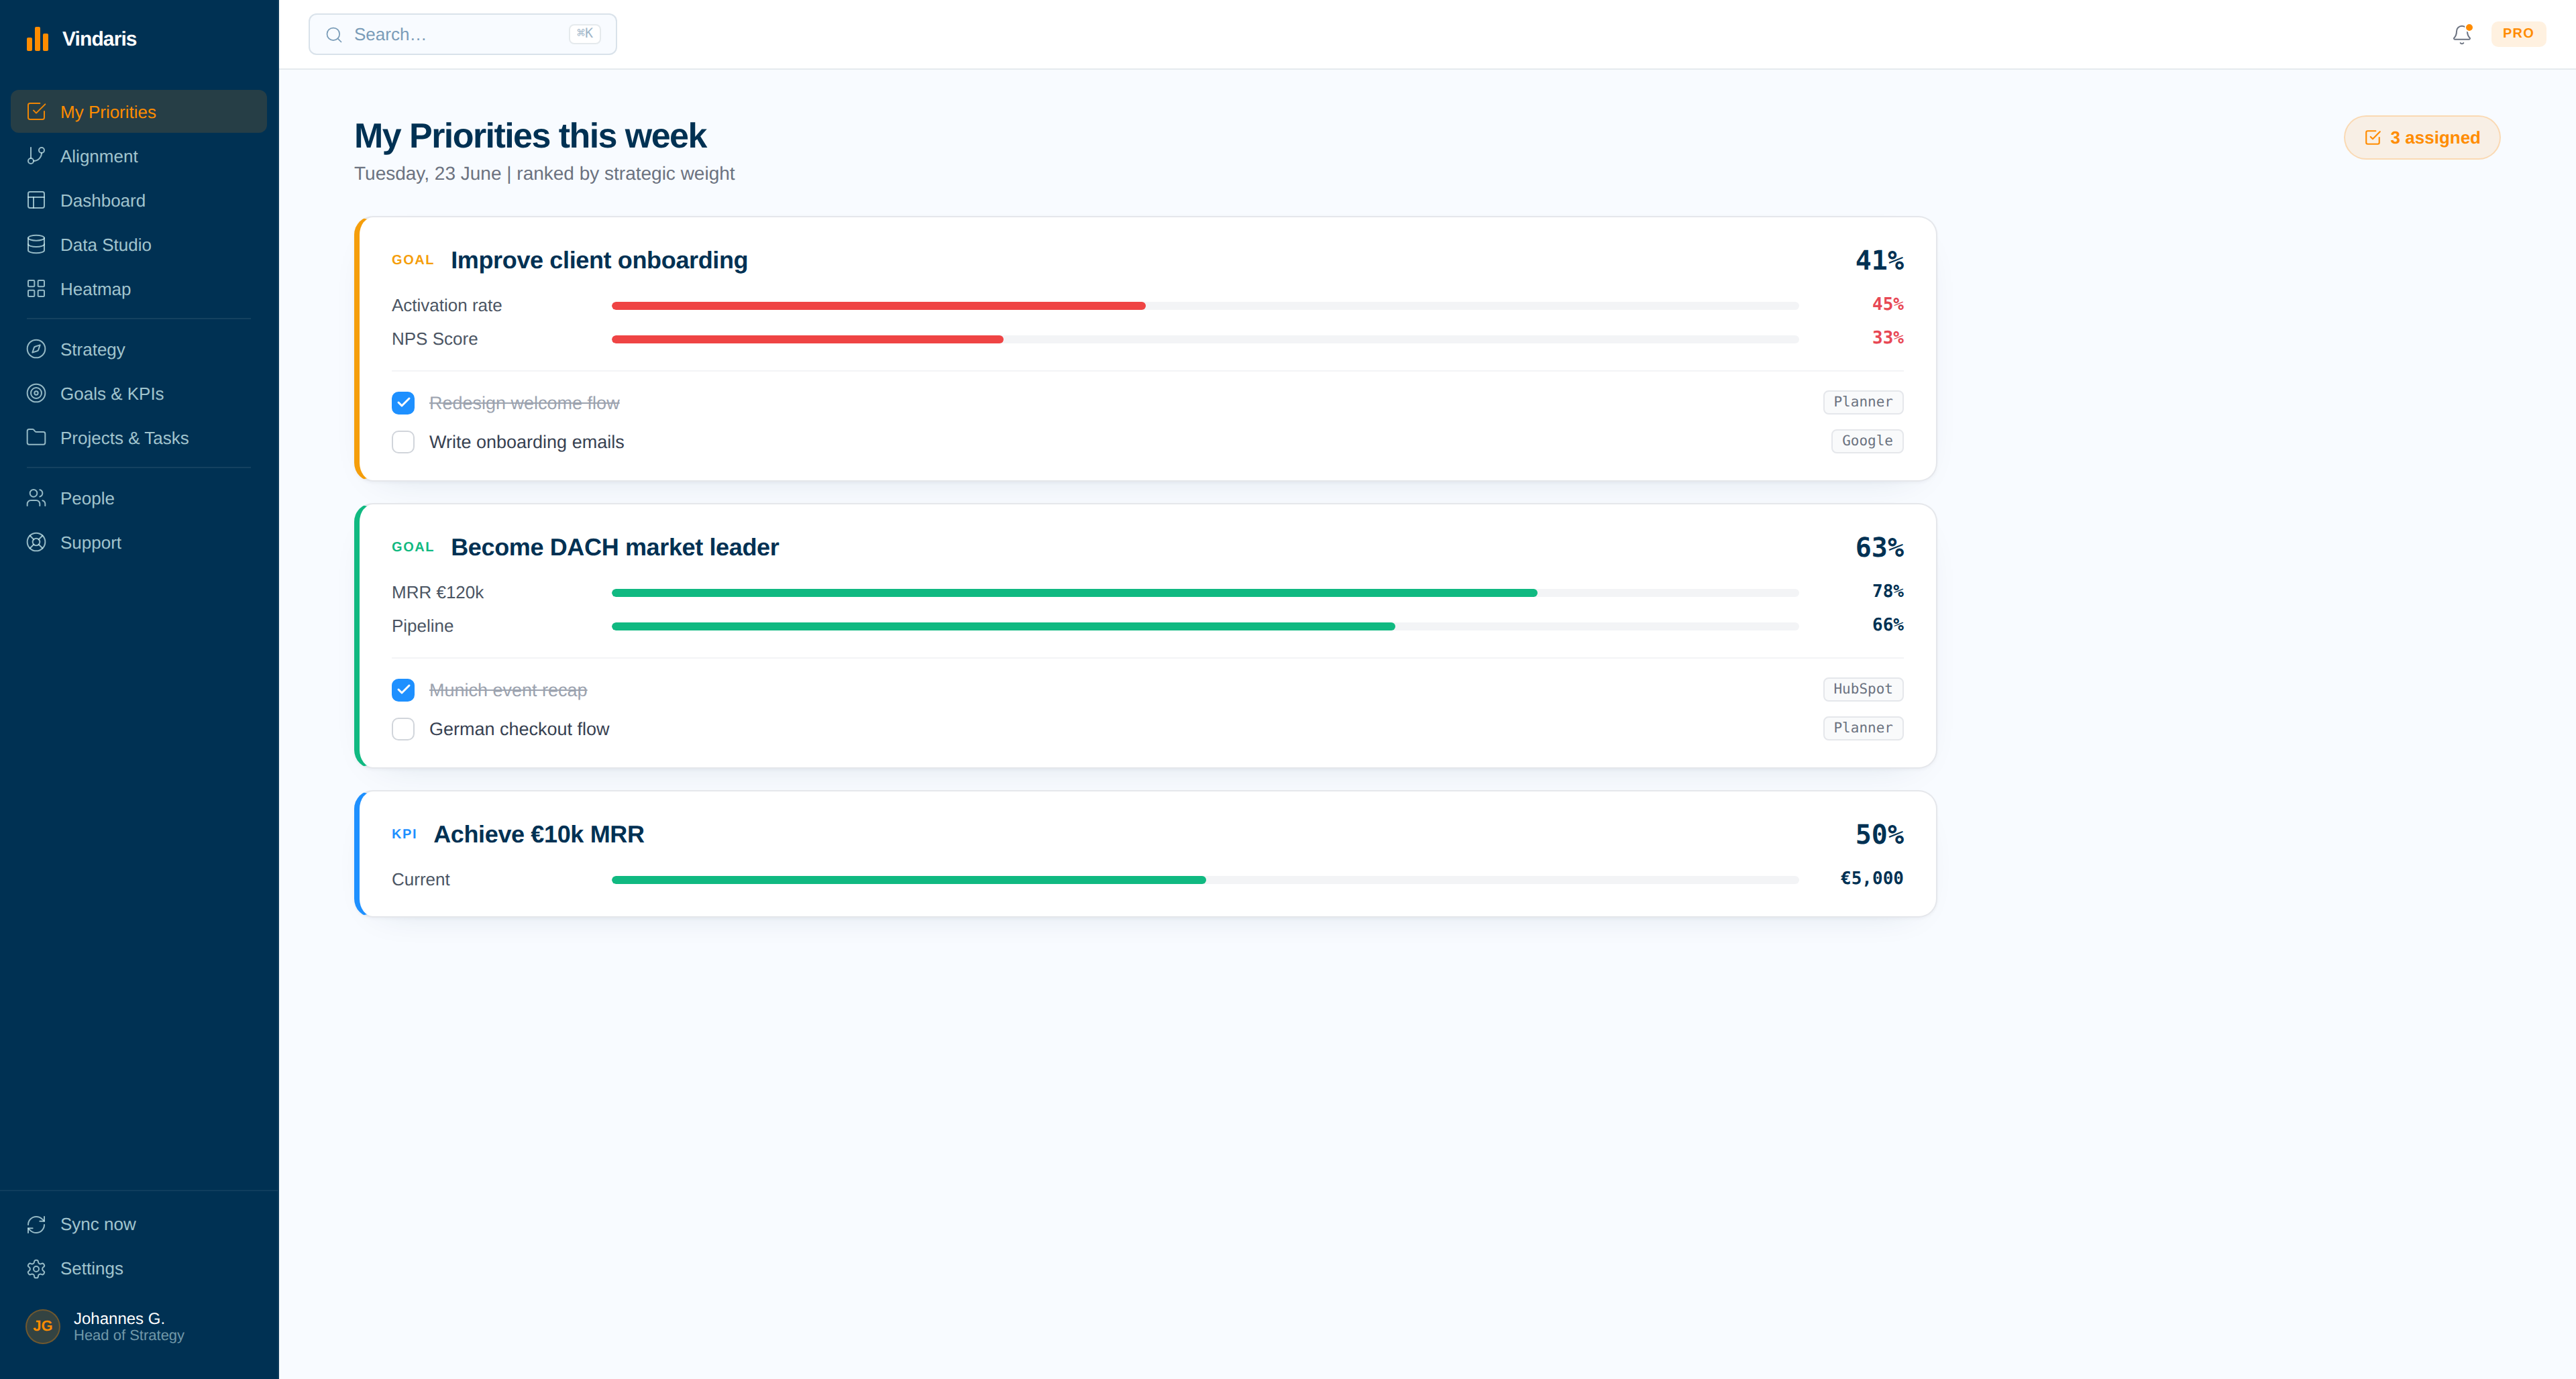
The X-matrix, with the deployment underneath it.
Hoshin is the most rigorous framework in common use and the least forgiving of stale data. A matrix of claimed relationships is only worth the freshness of what it claims, and nothing in a spreadsheet checks that.
Every relationship holds a live edge
The X-matrix declares which annual objective serves which breakthrough, which improvement priority serves which objective, and which metric proves it. In Vindaris each of those is an edge with real work under it, so a claimed relationship can be checked rather than assumed.
The negotiation leaves a record
Each level proposes how it will contribute and the level above responds. Vindaris keeps that exchange attached to the objective rather than in a thread nobody can find, so the commitment and the reasoning stay together for the year the plan runs.
Work stays where it lives
Connect HubSpot, Jira, Planner, Asana and Google Tasks. The improvement work under each breakthrough objective stays with the team that owns it, and the X-matrix reads its state directly.
Build your Hoshin hierarchy
Lay out breakthrough objectives, annual objectives, improvement priorities and the metrics that prove them, with the relationships between them drawn rather than implied by a grid position.
- Each level keeps its Hoshin name and its own card type.
- One improvement priority can serve two annual objectives.
Connect the tools the improvement work runs in
Plug in HubSpot, Microsoft Planner, Google Tasks, Asana or Jira. Catchball settles who owns what; the sync then shows whether the improvement work that was agreed is actually moving.
- A task closed in Jira closes in Vindaris, and back again.
- Every synced item keeps a tag pointing at its source tool, so the X-matrix can be audited end to end.
See deployment across every level at once
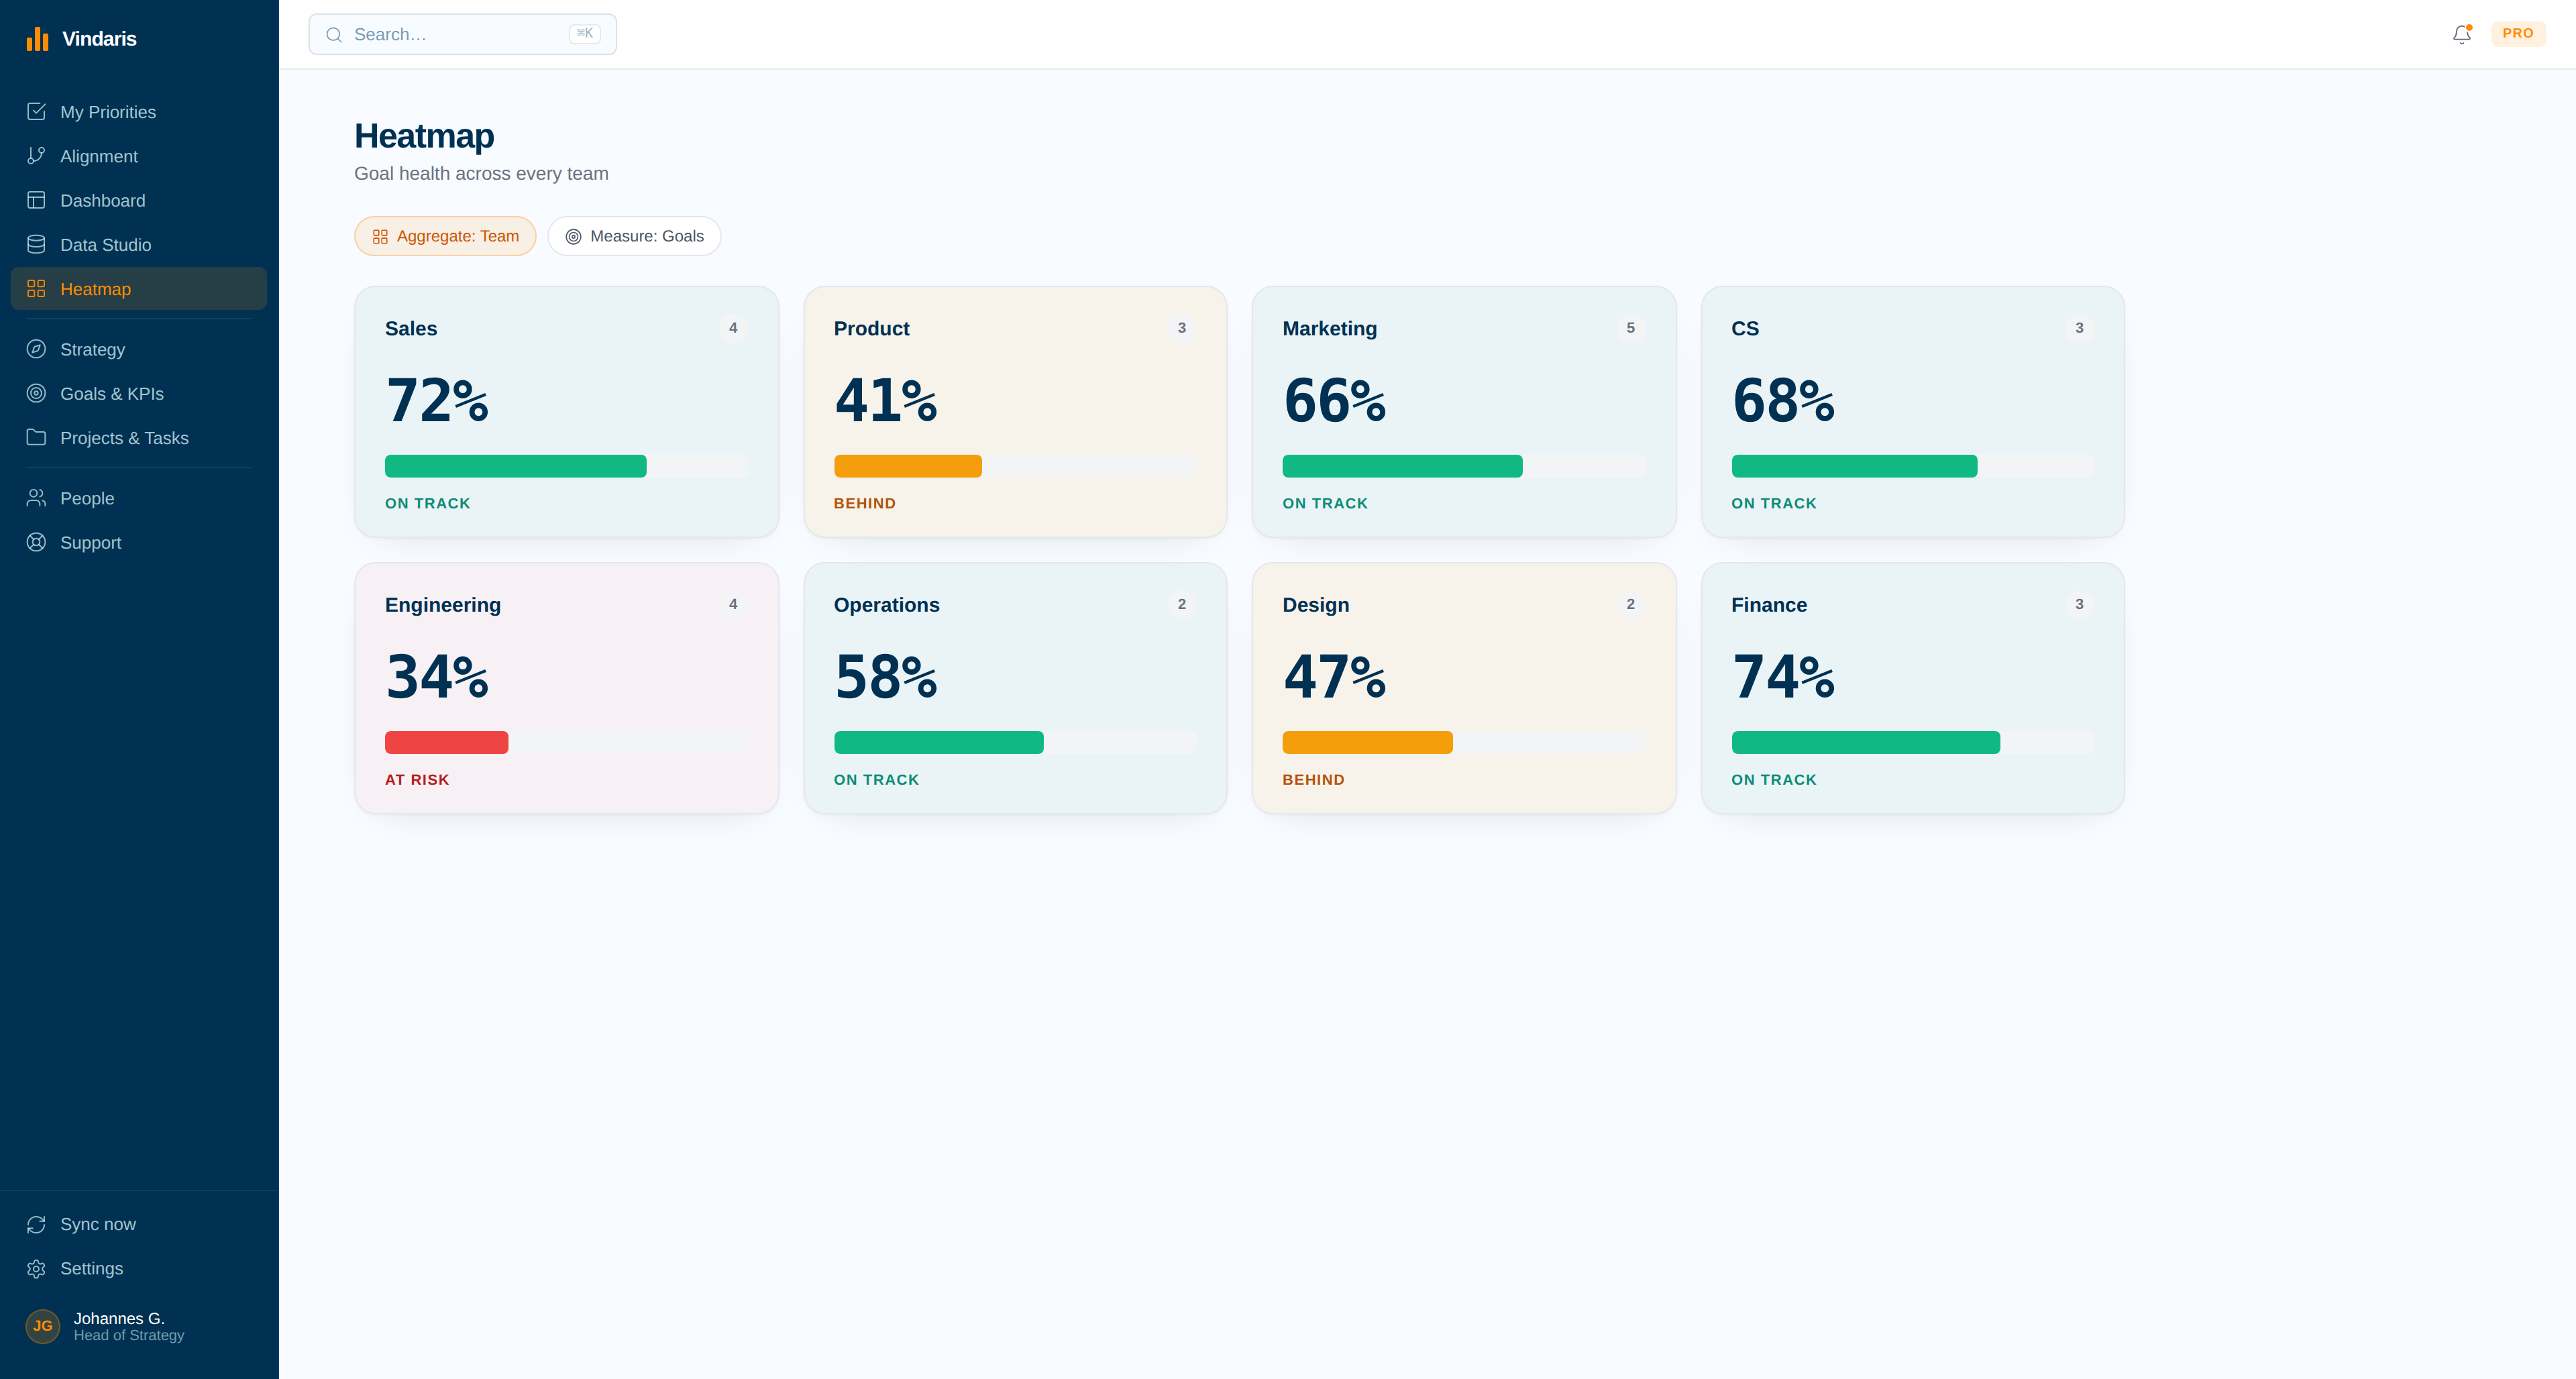
Hoshin fails quietly at the level nobody is watching. The Heatmap shades each team and objective by progress against plan, so a level that stopped deploying is visible as a block of colour rather than as an absence in a report.
- A tile per team, per objective, shaded by progress to plan.
- Click through to the improvement work that stopped moving.
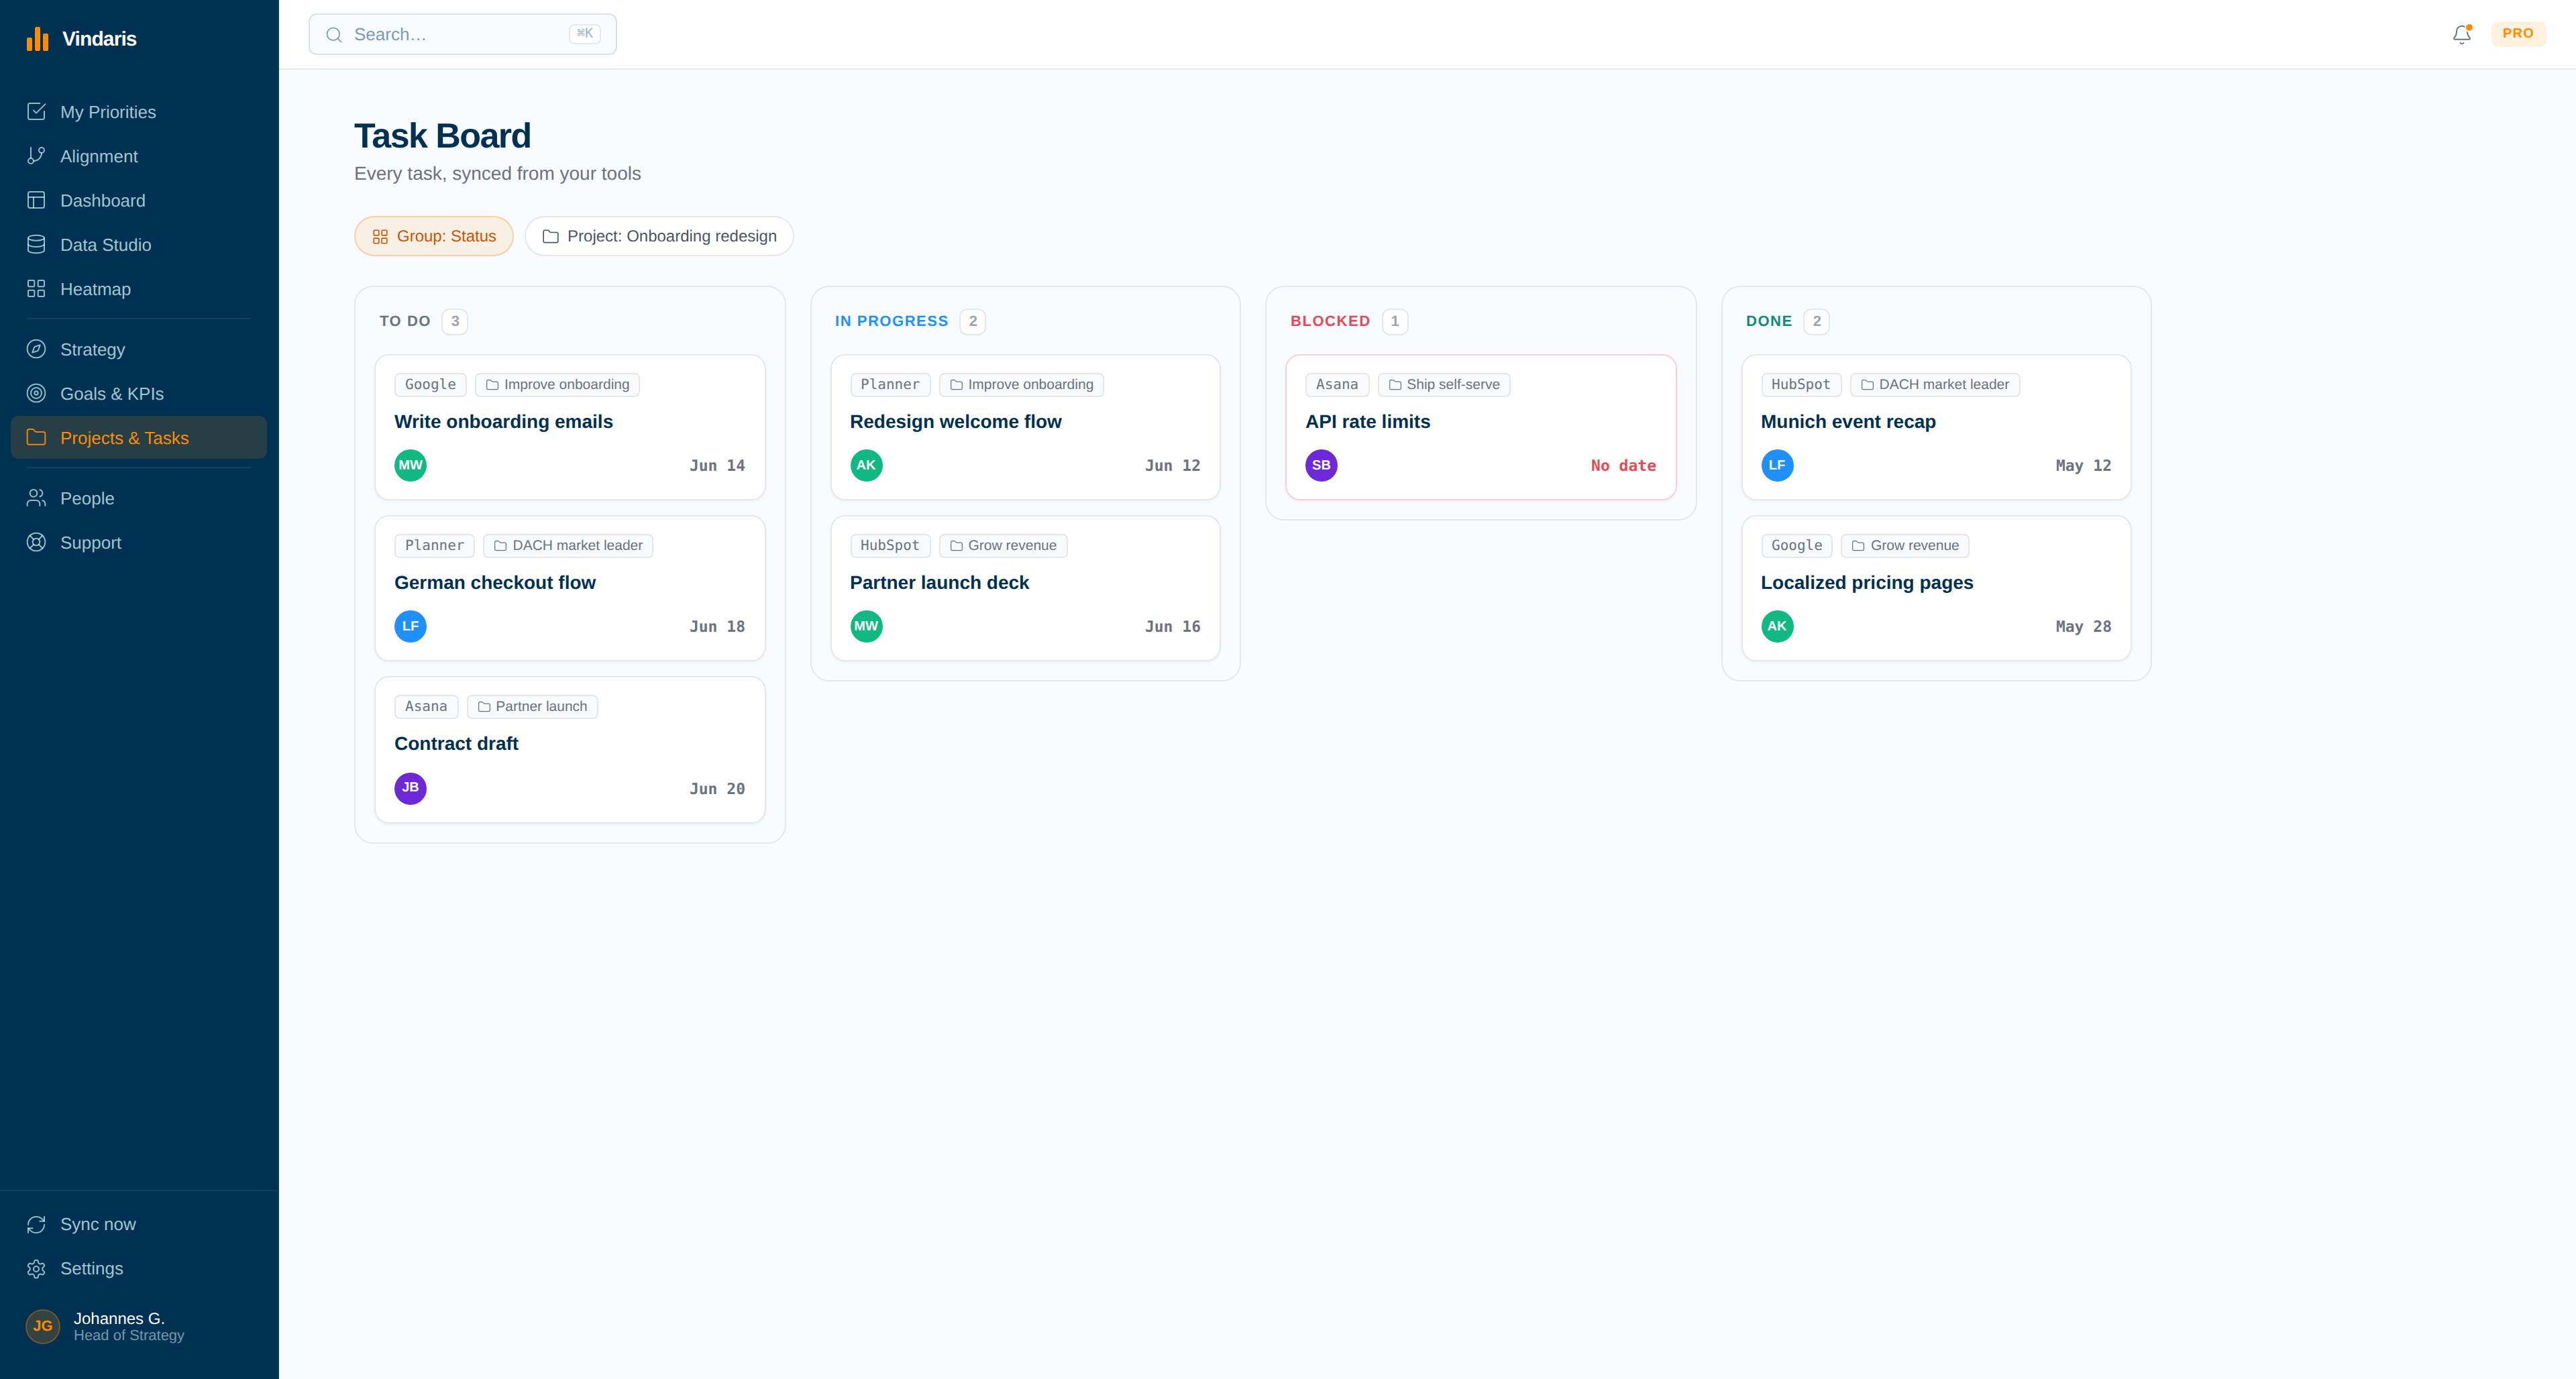
Keep the review honest between reviews
Owners get the deployment status of their own objectives on their own schedule, by email, Slack or Teams. The annual review stops being the first moment anyone notices a priority has not moved since spring.
- Delivered on the owner's cadence, not the reporting calendar.
- Names the priority, the gap and the work that caused it.
Capture catchball as it was actually agreed.
The commitment a level makes is a sentence before it is a cell. Write it as it was said, tag the objective and the improvement priority with @, and the matrix records the reasoning alongside the relationship.
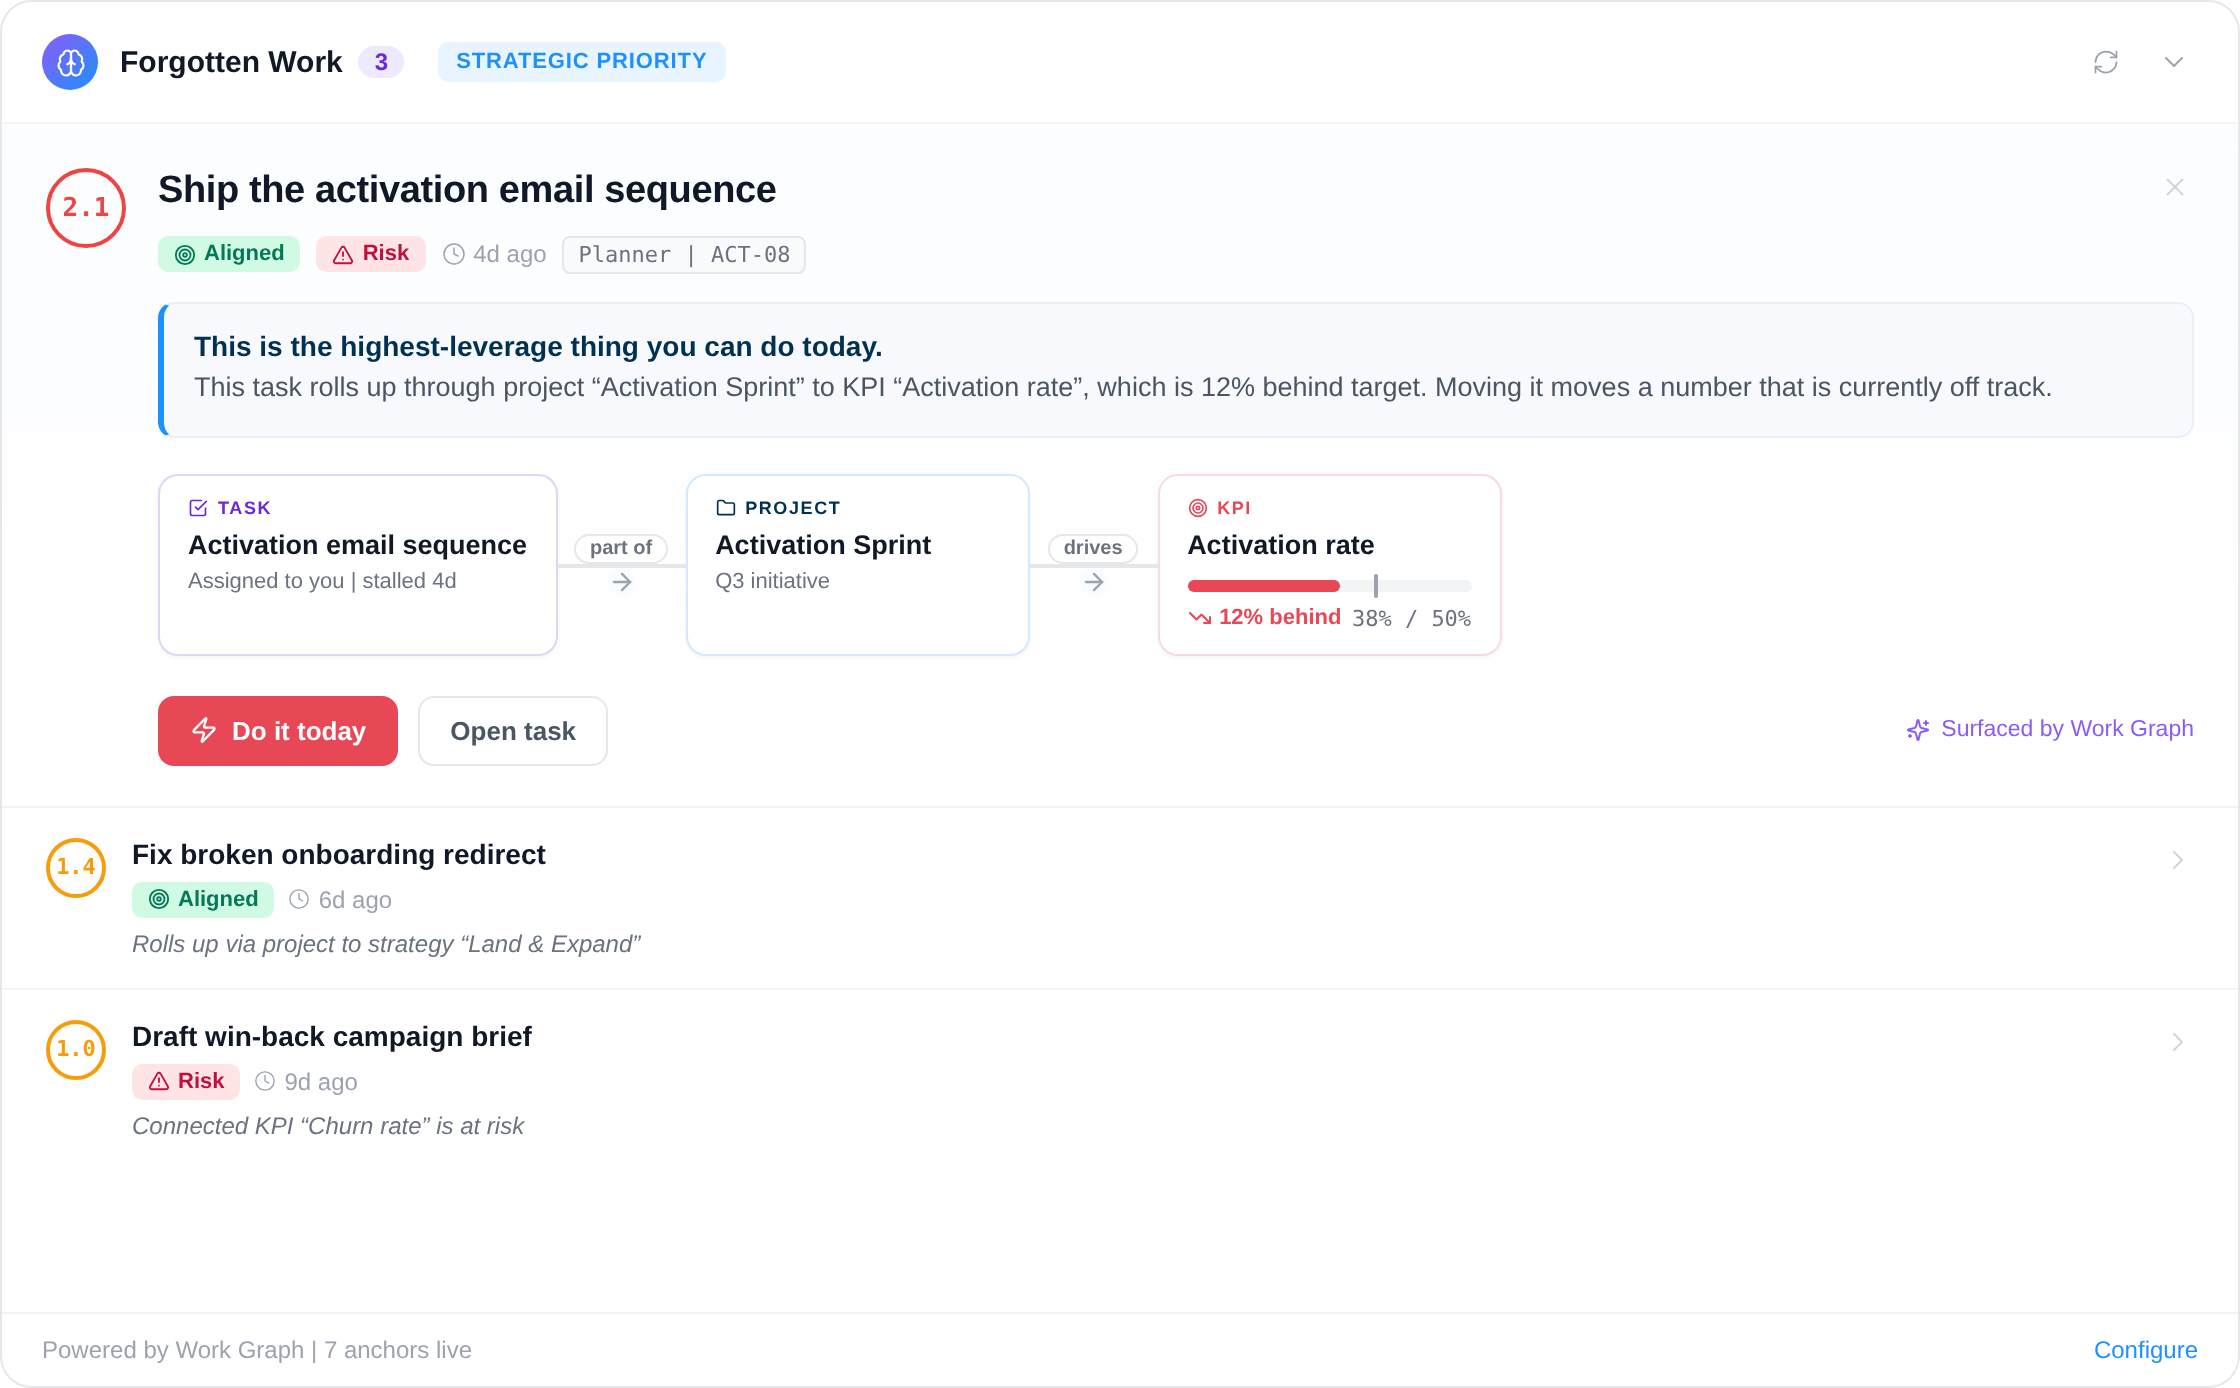
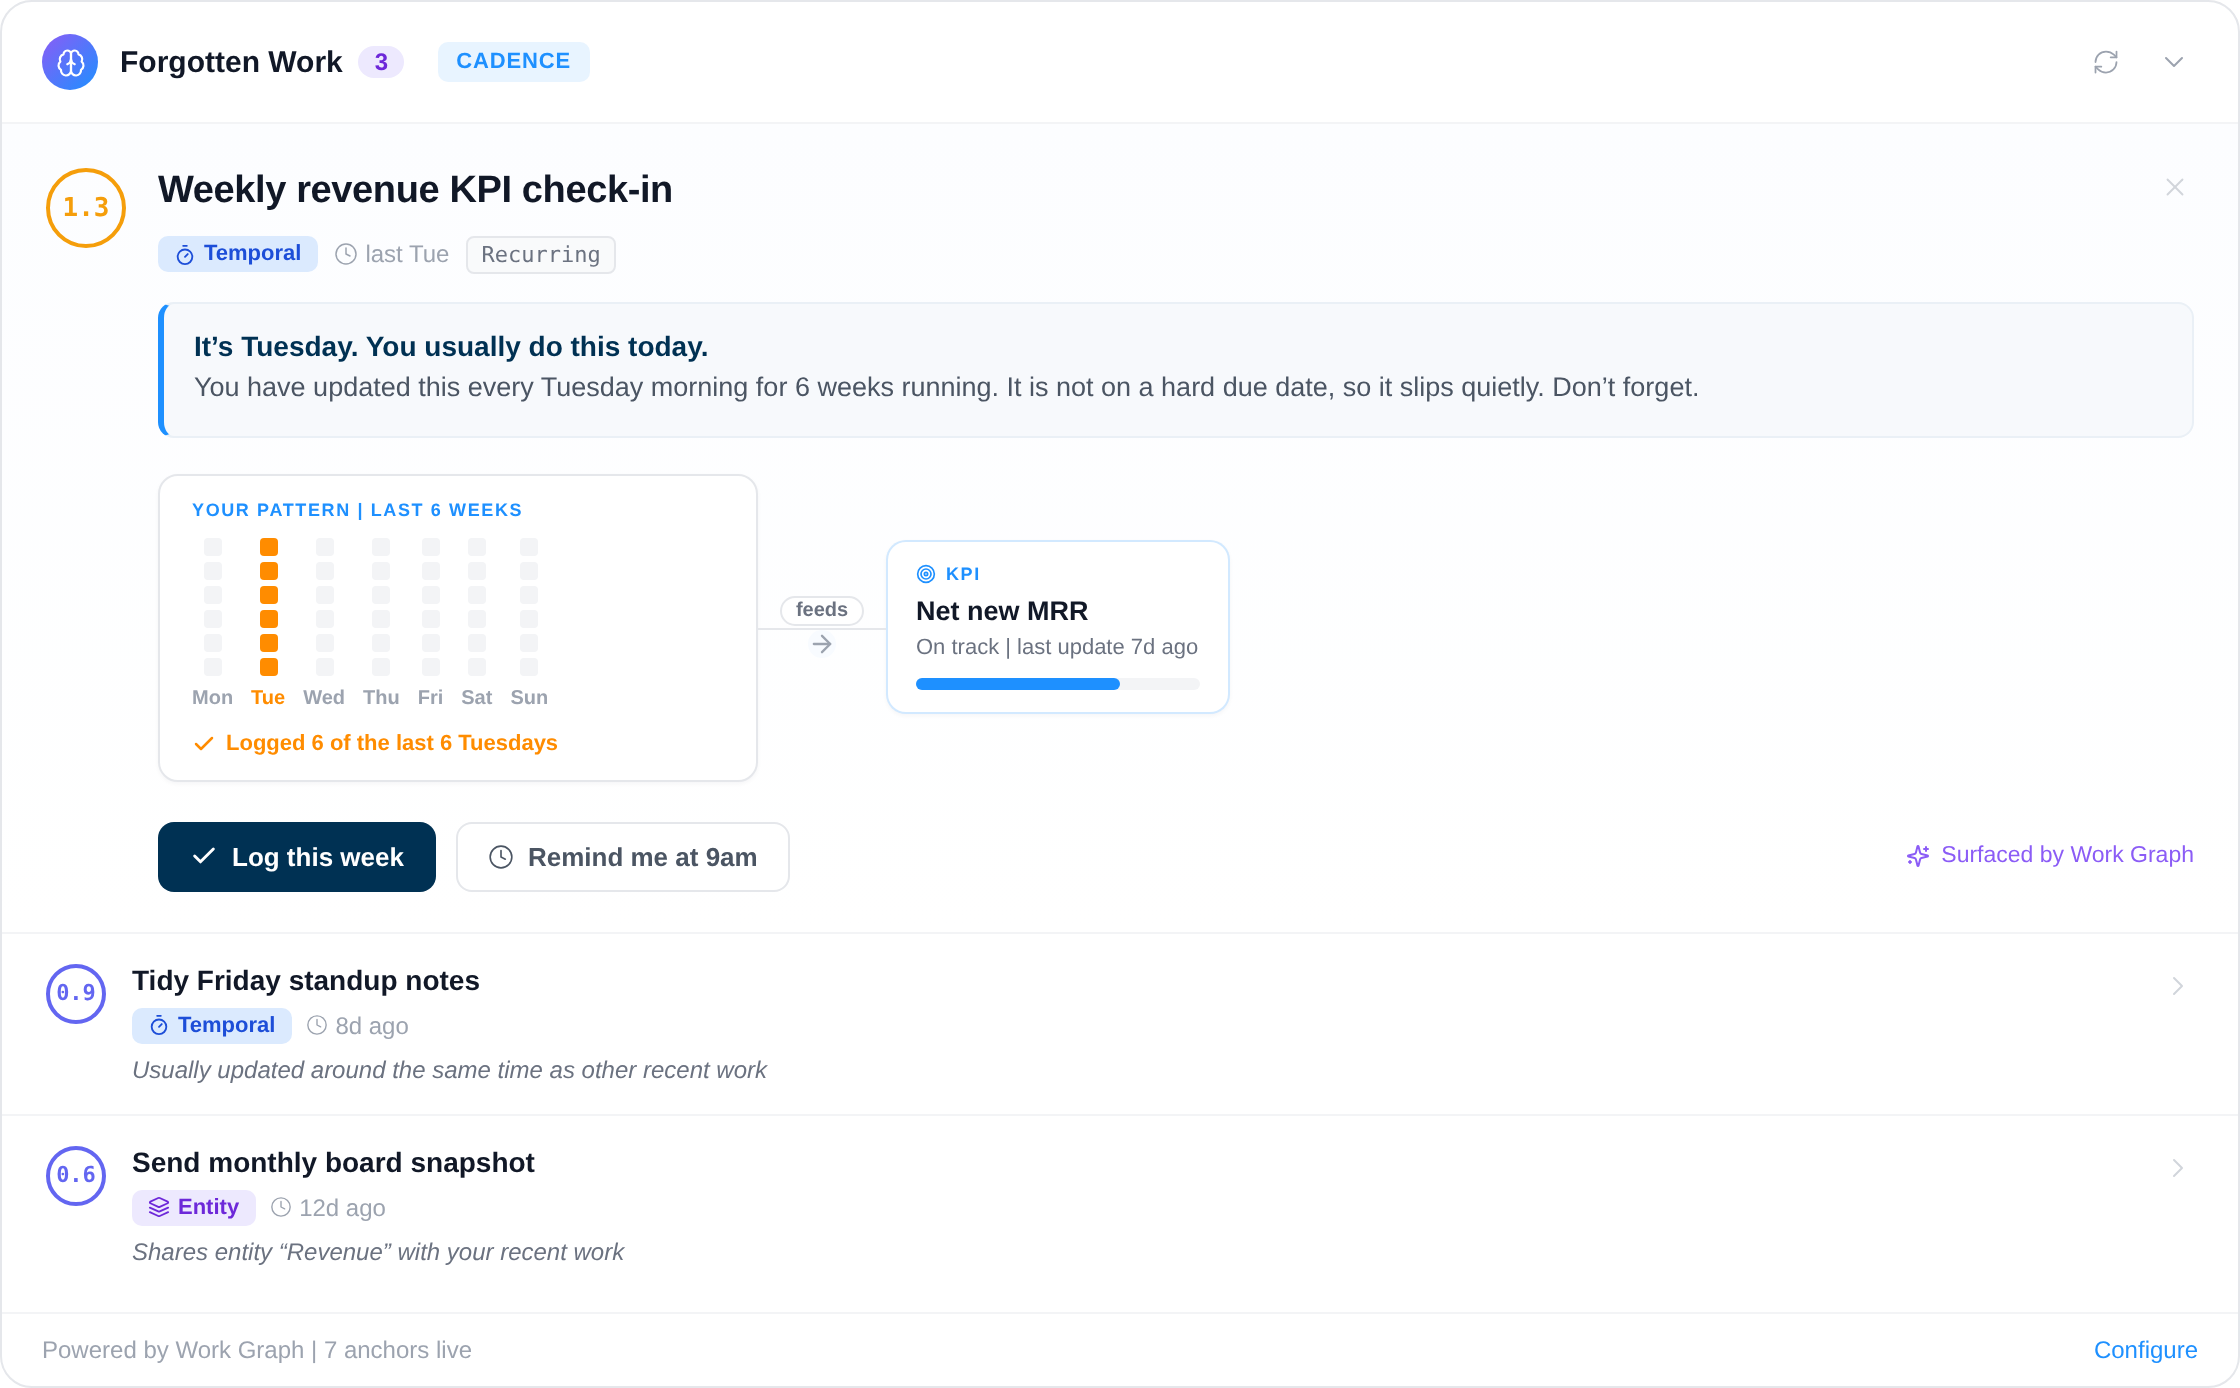
Four of the twelve alerts, in Hoshin terms.
The Work Graph reads the edges the X-matrix declares. A matrix is a set of claimed relationships; these four alerts are what checking them looks like in practice.
Twelve deterministic and AI-driven alerts watching for slipping work, broken routines and misaligned focus.
Your framework, your language, your data in Europe.
Vindaris supports Hoshin as practised rather than as diagrammed, including catchball across levels and the awkward reality that not every level uses the X-matrix.
Runs the Hoshin cascade at any depth
Vindaris ships without a prescribed methodology and without a fixed number of levels, so a cascade can run from breakthrough objective to shop-floor task without being flattened. The same workspace can hold Hoshin for operations while a commercial team runs OKRs.
Free forever, including two integrations.
Free covers the full Hoshin hierarchy, catchball and deployment tracking for up to 5 people. Pay when you deploy to more levels or connect more tools.
Best for individual contributors, small teams or startups. No credit card required.
- All views: Canvas, My Priorities, Heatmap, Data Studio and Task Board
- Two integrations of your choice
- Up to four additional members
- Five ad-hoc AI risk summaries per month
Best for teams, small agencies, or departmental and team management.
- Everything in Free
- All integrations, unlimited sync
- Unlimited AI risk summaries and alignment suggestions
- Up to ten users in one organization
Best for multiple teams, exec teams, Chiefs of Staff or full-org deployments.
- Everything in Connect
- Unlimited users in one organization
- Direct human support, 24h response
- Human-led onboarding
Start with the matrix on a page.
Real Excel and PowerPoint files and browser tools that run without an account, including an X-matrix you can fill in before deciding anything.
Common questions, answered
What is Hoshin Kanri software?
Hoshin Kanri software helps organizations deploy strategic plans from top-level breakthrough objectives down to team-level improvement priorities. Vindaris supports the full Hoshin process and connects each priority to real tasks so progress is always traceable.
How does Hoshin Kanri differ from OKRs?
Hoshin Kanri focuses on a small number of breakthrough objectives deployed through catchball alignment across all levels of the organization. OKRs tend to be shorter-cycle and broader in scope. Vindaris supports both, so you can use whichever fits your planning cadence.
Can Vindaris support the X-matrix?
Yes. Vindaris lets you map breakthrough objectives to annual objectives, improvement priorities, and measurable targets in a connected structure. Because tasks link directly to priorities, your X-matrix reflects live progress from real work.
How does Vindaris connect breakthrough objectives to daily work?
Each improvement priority links to tasks in Jira, Microsoft Planner, Google Tasks, or HubSpot. Task completion rolls up through annual objectives to breakthrough goals automatically, giving leadership a live view of strategic execution.
Know where deployment is drifting before the annual review does.
Connect your first tool in 90 seconds. Free forever for Hoshin Kanri management.
Start your Hoshin plan freeNo credit card | No migration | No minimum contract