 Power BI
The measure your BI team already certified, feeding the goal directly.
Your organization spent a long time agreeing what a metric means and encoding it in a Power BI measure. Vindaris runs that measure and records the result against the KPI, so the strategy board and the BI layer stop producing two versions of the truth.
Free forever | Two integrations included | Your team keeps working in Power BI
Reuse the definition instead of re-deriving it.
The expensive part of a KPI is not reading the number, it is agreeing what counts. Power BI measures already carry that agreement, so Vindaris reads them rather than asking you to rebuild the logic in a strategy tool.
Browse your Power BI workspaces and datasets in the connect flow and pick a measure from a list. Vindaris builds the DAX for you.
For anything the measure picker cannot express, supply the DAX query directly and Vindaris executes it the same way.
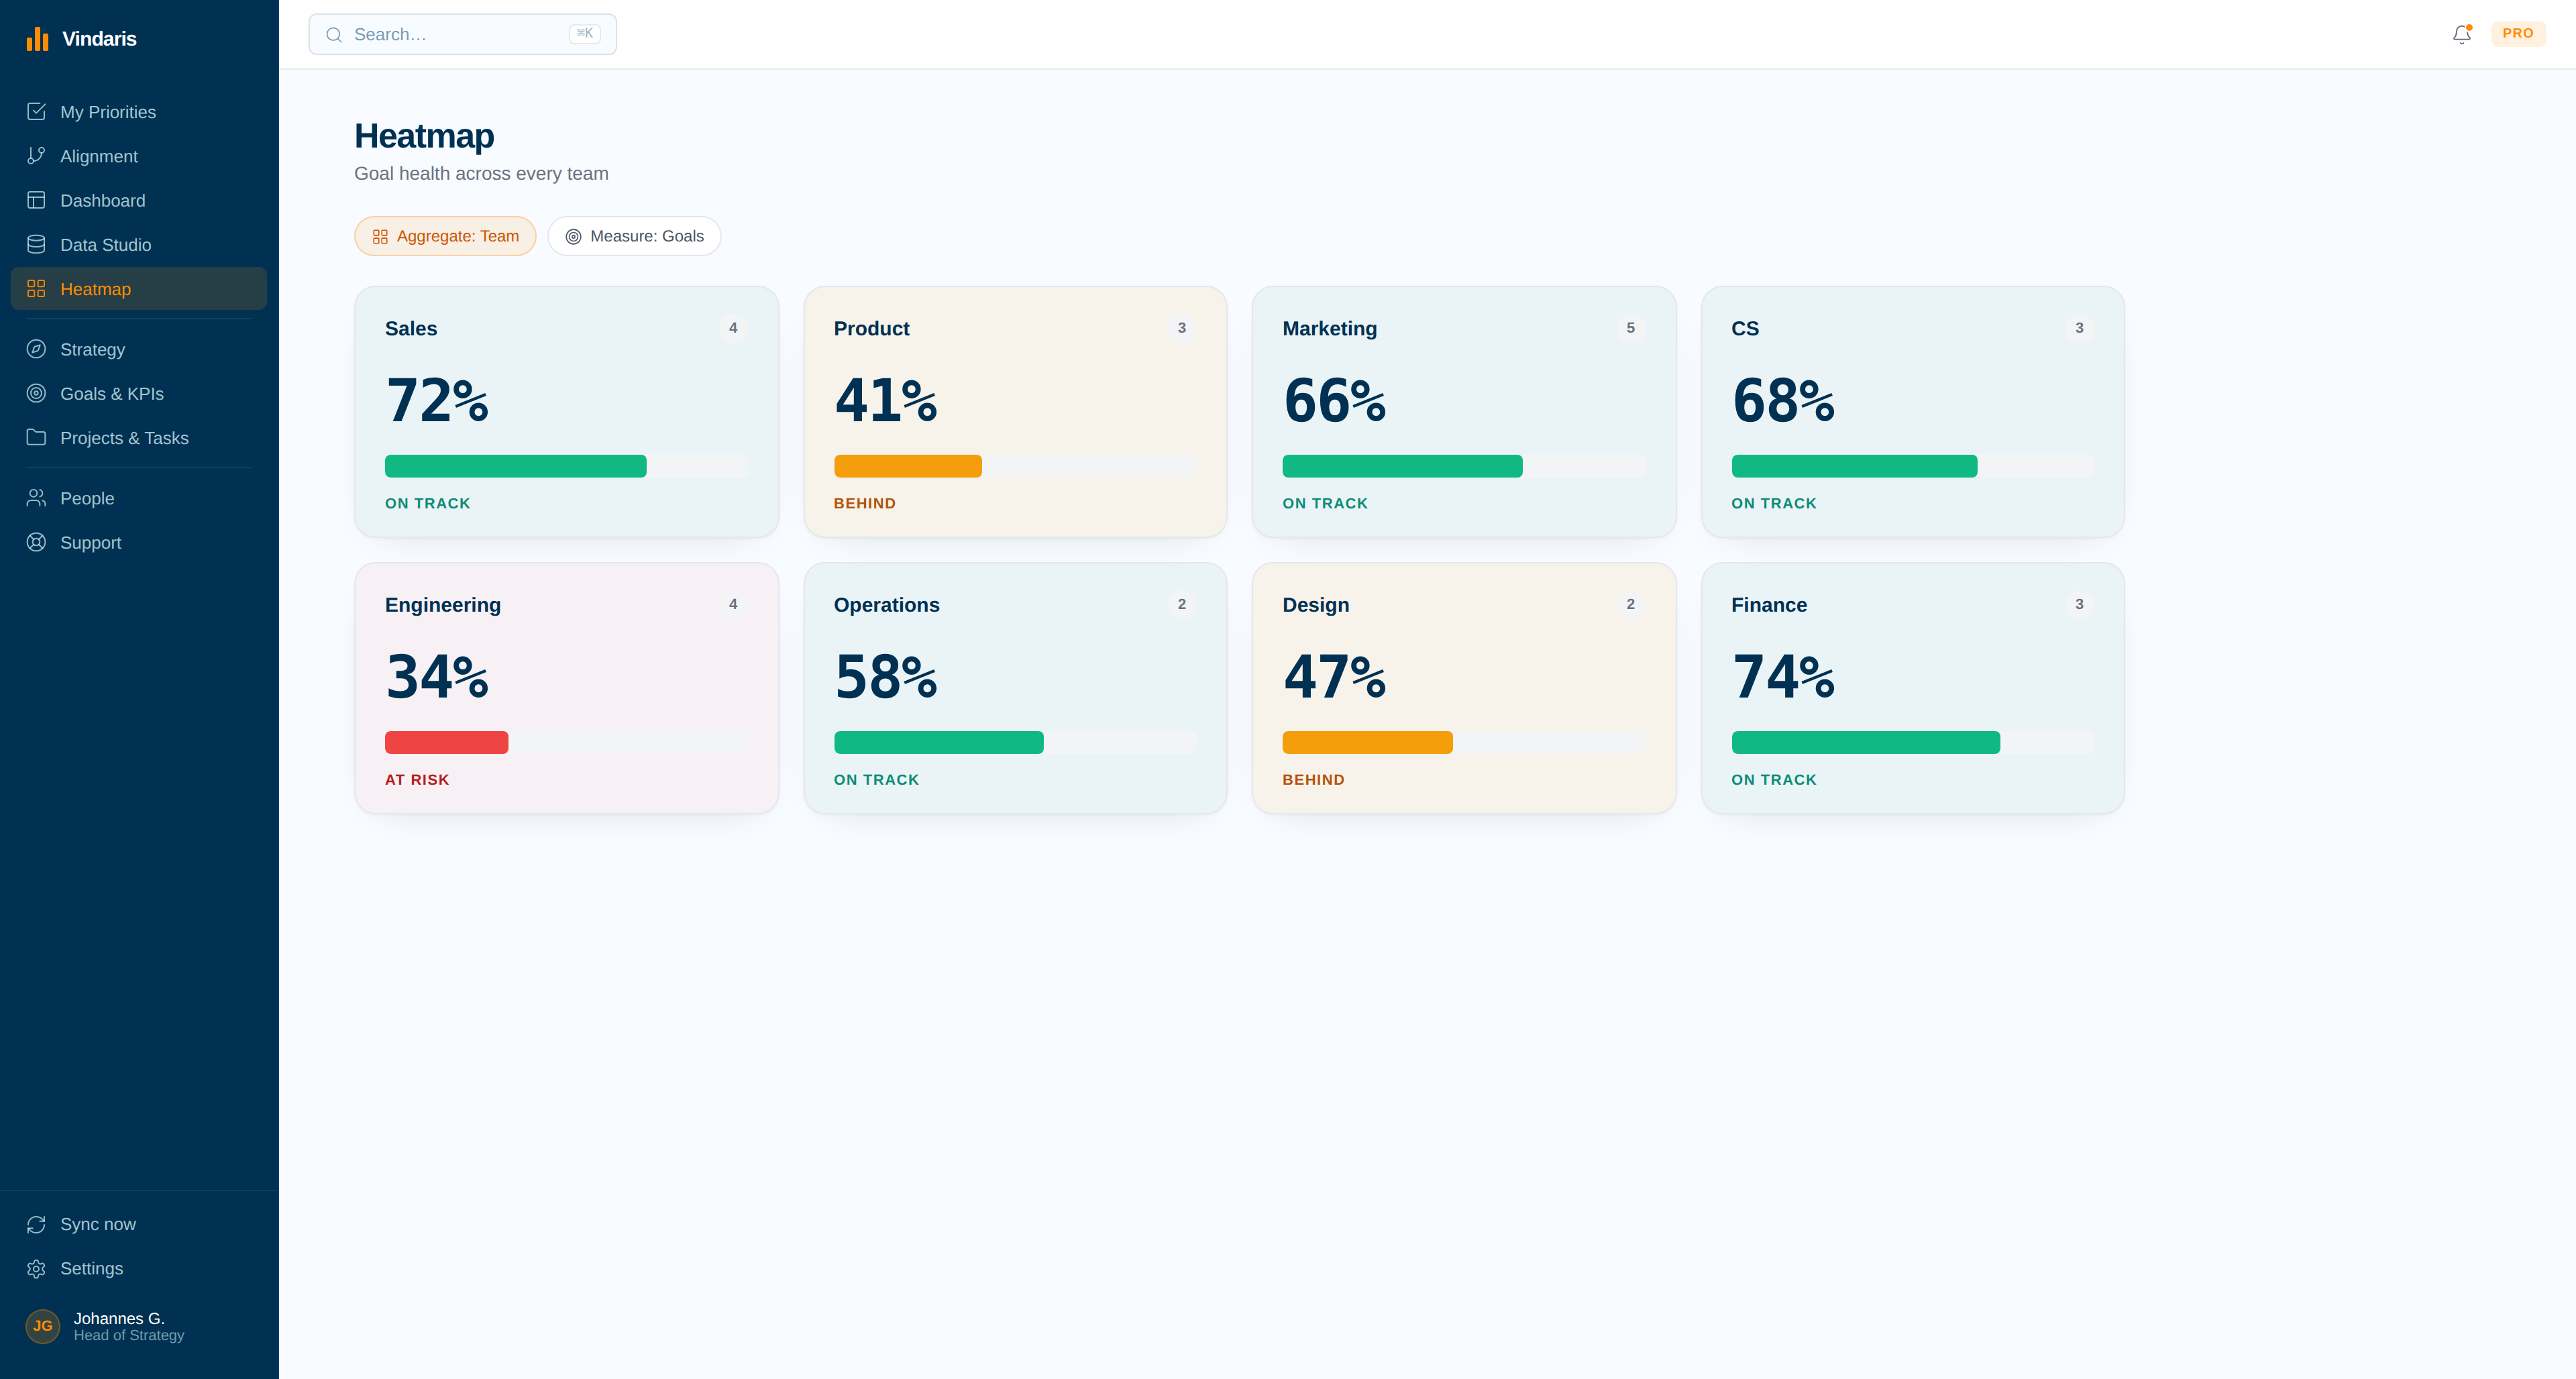
The query result is coerced to a single number and stored as a KPI update, which gives the metric a clean daily history.
Because the calculation stays in Power BI, changes made by the BI team flow through automatically. There is no second implementation to keep in step.
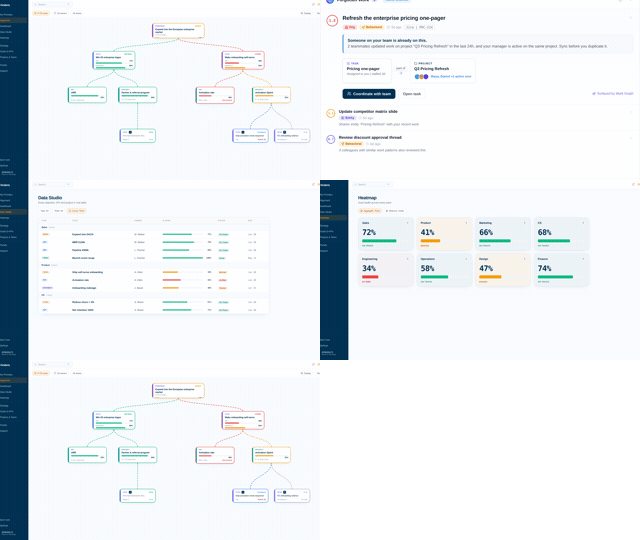
With daily history, the Work Graph compares the trend to the target date and flags a KPI that can no longer reach it at the current rate.
Vindaris executes queries. It does not write to datasets, publish reports, or alter anything in your Power BI tenant.
Sign in, pick a measure, bind it.
No dataset changes, no gateway configuration, and nothing new for the BI team to maintain.
Authorize against the Power BI service. The consent is separate from other Microsoft integrations, so scopes stay tight.
Select the workspace, then the dataset, then the measure that represents your KPI. Vindaris shows the value it reads back.
Attach it to the KPI on your strategy board. The daily job takes over from there.
Connect the projects and tasks intended to move the measure so effort and outcome can be compared rather than assumed.
One number, two audiences.
The BI report and the strategy board now read the same measure, which removes the most common cause of a leadership meeting stalling on whose figure is correct.
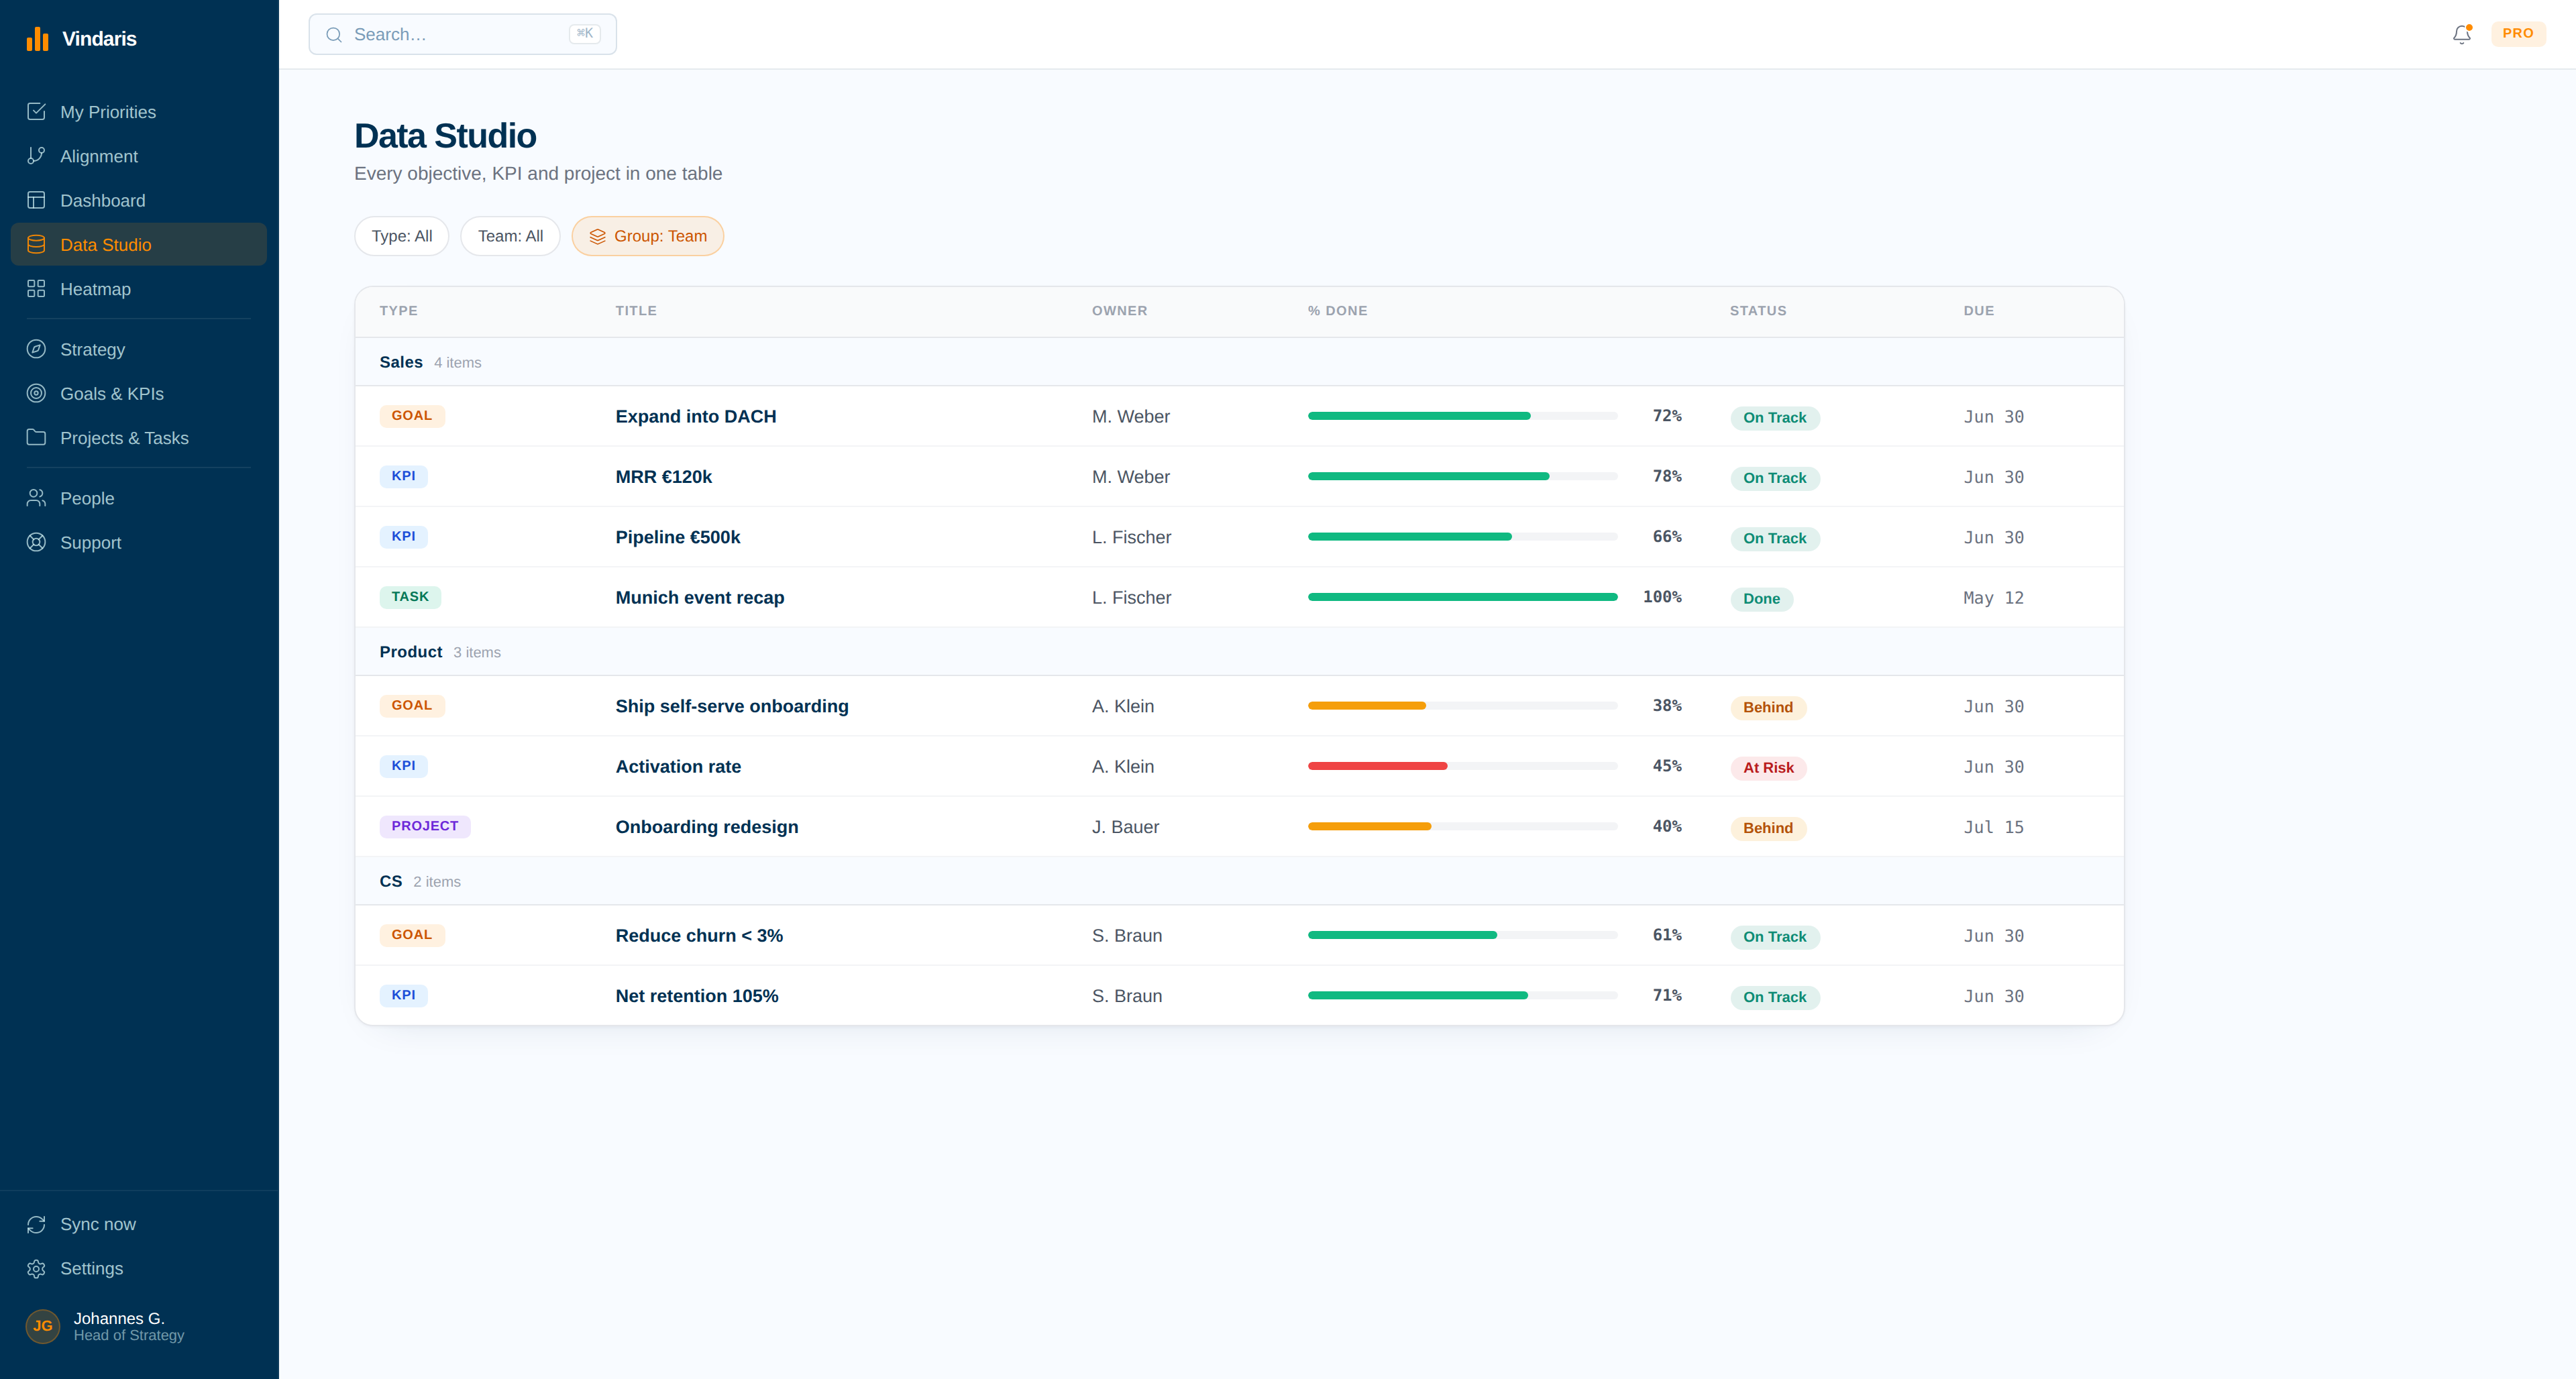
Which KPIs are quietly off pace.
With every measure recorded daily, the heatmap shows the metrics drifting away from their targets while there is still time to redirect effort.
A dashboard reports the number. It does not judge whether the target is still reachable.
Power BI is excellent at showing what happened and what is happening. What it does not do is hold the target, the owner, the work meant to move the metric, or the question of whether the current trajectory arrives in time. That reasoning happens in a meeting, from memory, once a month.
Vindaris adds that layer on top of the same measure. The KPI carries a target and an owner, the work connected to it is visible, and pace is calculated continuously. When the required run rate becomes implausible, the goal is flagged with the effort behind it attached, which is a far more useful artefact than a line chart trending in the wrong direction.
Where to go next
Power BI and Vindaris, answered
Do I need to write DAX?
Usually not. The connect flow lets you browse workspace, dataset, and measure, and Vindaris builds the query. For calculations the picker cannot express, you can supply DAX directly.
Does Vindaris change anything in Power BI?
No. The integration executes queries and reads the result. It does not write to datasets, publish reports, or alter anything in your tenant.
What if the BI team changes the measure?
The KPI follows automatically, because the calculation stays in Power BI. That is the main reason to source a metric this way rather than reimplementing the logic in a second tool.
Can Vindaris tell me a KPI will miss its target?
Yes. Values are recorded daily, so the KPI has a trend. The Work Graph compares that trend to the target date and flags the goal when the required run rate stops being achievable.
Let the certified measure drive the goal.
Connect Power BI in a couple of minutes. Free forever for goal management, two integrations included.
Connect Power BI freeNo credit card | No migration | Nobody leaves Power BI