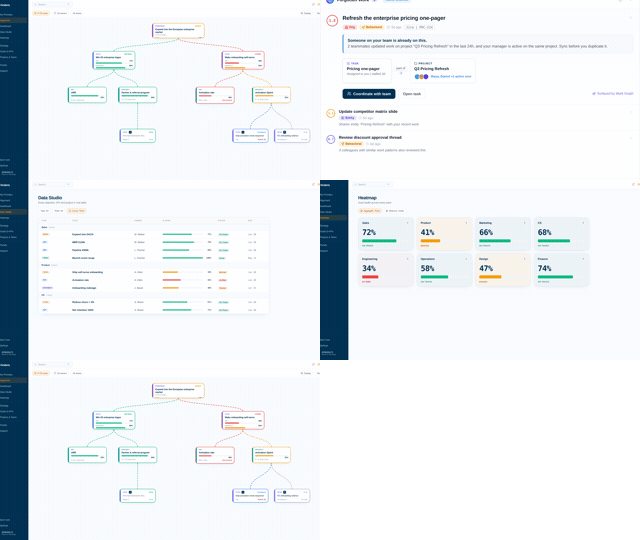
KPI tracking software that warns you before the number misses.
Vindaris maps your strategy, goals and KPIs down to the projects and tasks meant to move them, in the tools your team already uses. The Work Graph then measures the pace of that work against each target and flags the moment a KPI can no longer be reached at the current rate of progress.
Down to the individual task and the Slack thread around it, so the alert names the work holding the number back, not just the number.





What is KPI tracking software?
KPI tracking software monitors key performance indicators against their targets over time. Every product in the category shows you the current value. The difference is what sits behind it: most dashboards read a number synced from another system or typed in by an owner, so the first warning of a miss is the miss itself. Vindaris connects each KPI to the projects and tasks meant to move it, which is what makes pace, and not just position, visible.
How is this different from a BI tool?
A BI tool answers questions about your data and does it well. It cannot know which numbers carry a commitment, who owns them, or what work is supposed to move them. KPI tracking adds the target, the owner, the deadline and the connected work, which turns a chart into something that can raise its hand.
What makes KPI tracking automatic?
The connection to the work. When a KPI reads from the tasks and projects beneath it, there is no weekly update to collect and no incentive to round the number up before a review. The value moves when the work moves, and stalls are visible as stalls rather than as an unchanged cell.
Why track pace instead of just the value?
Because the value is a lagging fact and pace is an early warning. A KPI at 60% of target can be perfectly healthy in week four and unrecoverable in week ten. Measuring the rate of progress against the time remaining is what tells those two situations apart while there is still time to act.
Which KPIs belong in a tracker?
The few with a strategic commitment behind them. A tracker holding forty indicators per team is a metrics warehouse, and the important ones drown. Most teams land on a handful of KPIs each, connected upward to a goal, which is also what keeps the KPI versus OKR boundary clean.
 Click thru live demo
Pre-built workspace. No signup.
Click thru live demo
Pre-built workspace. No signup.
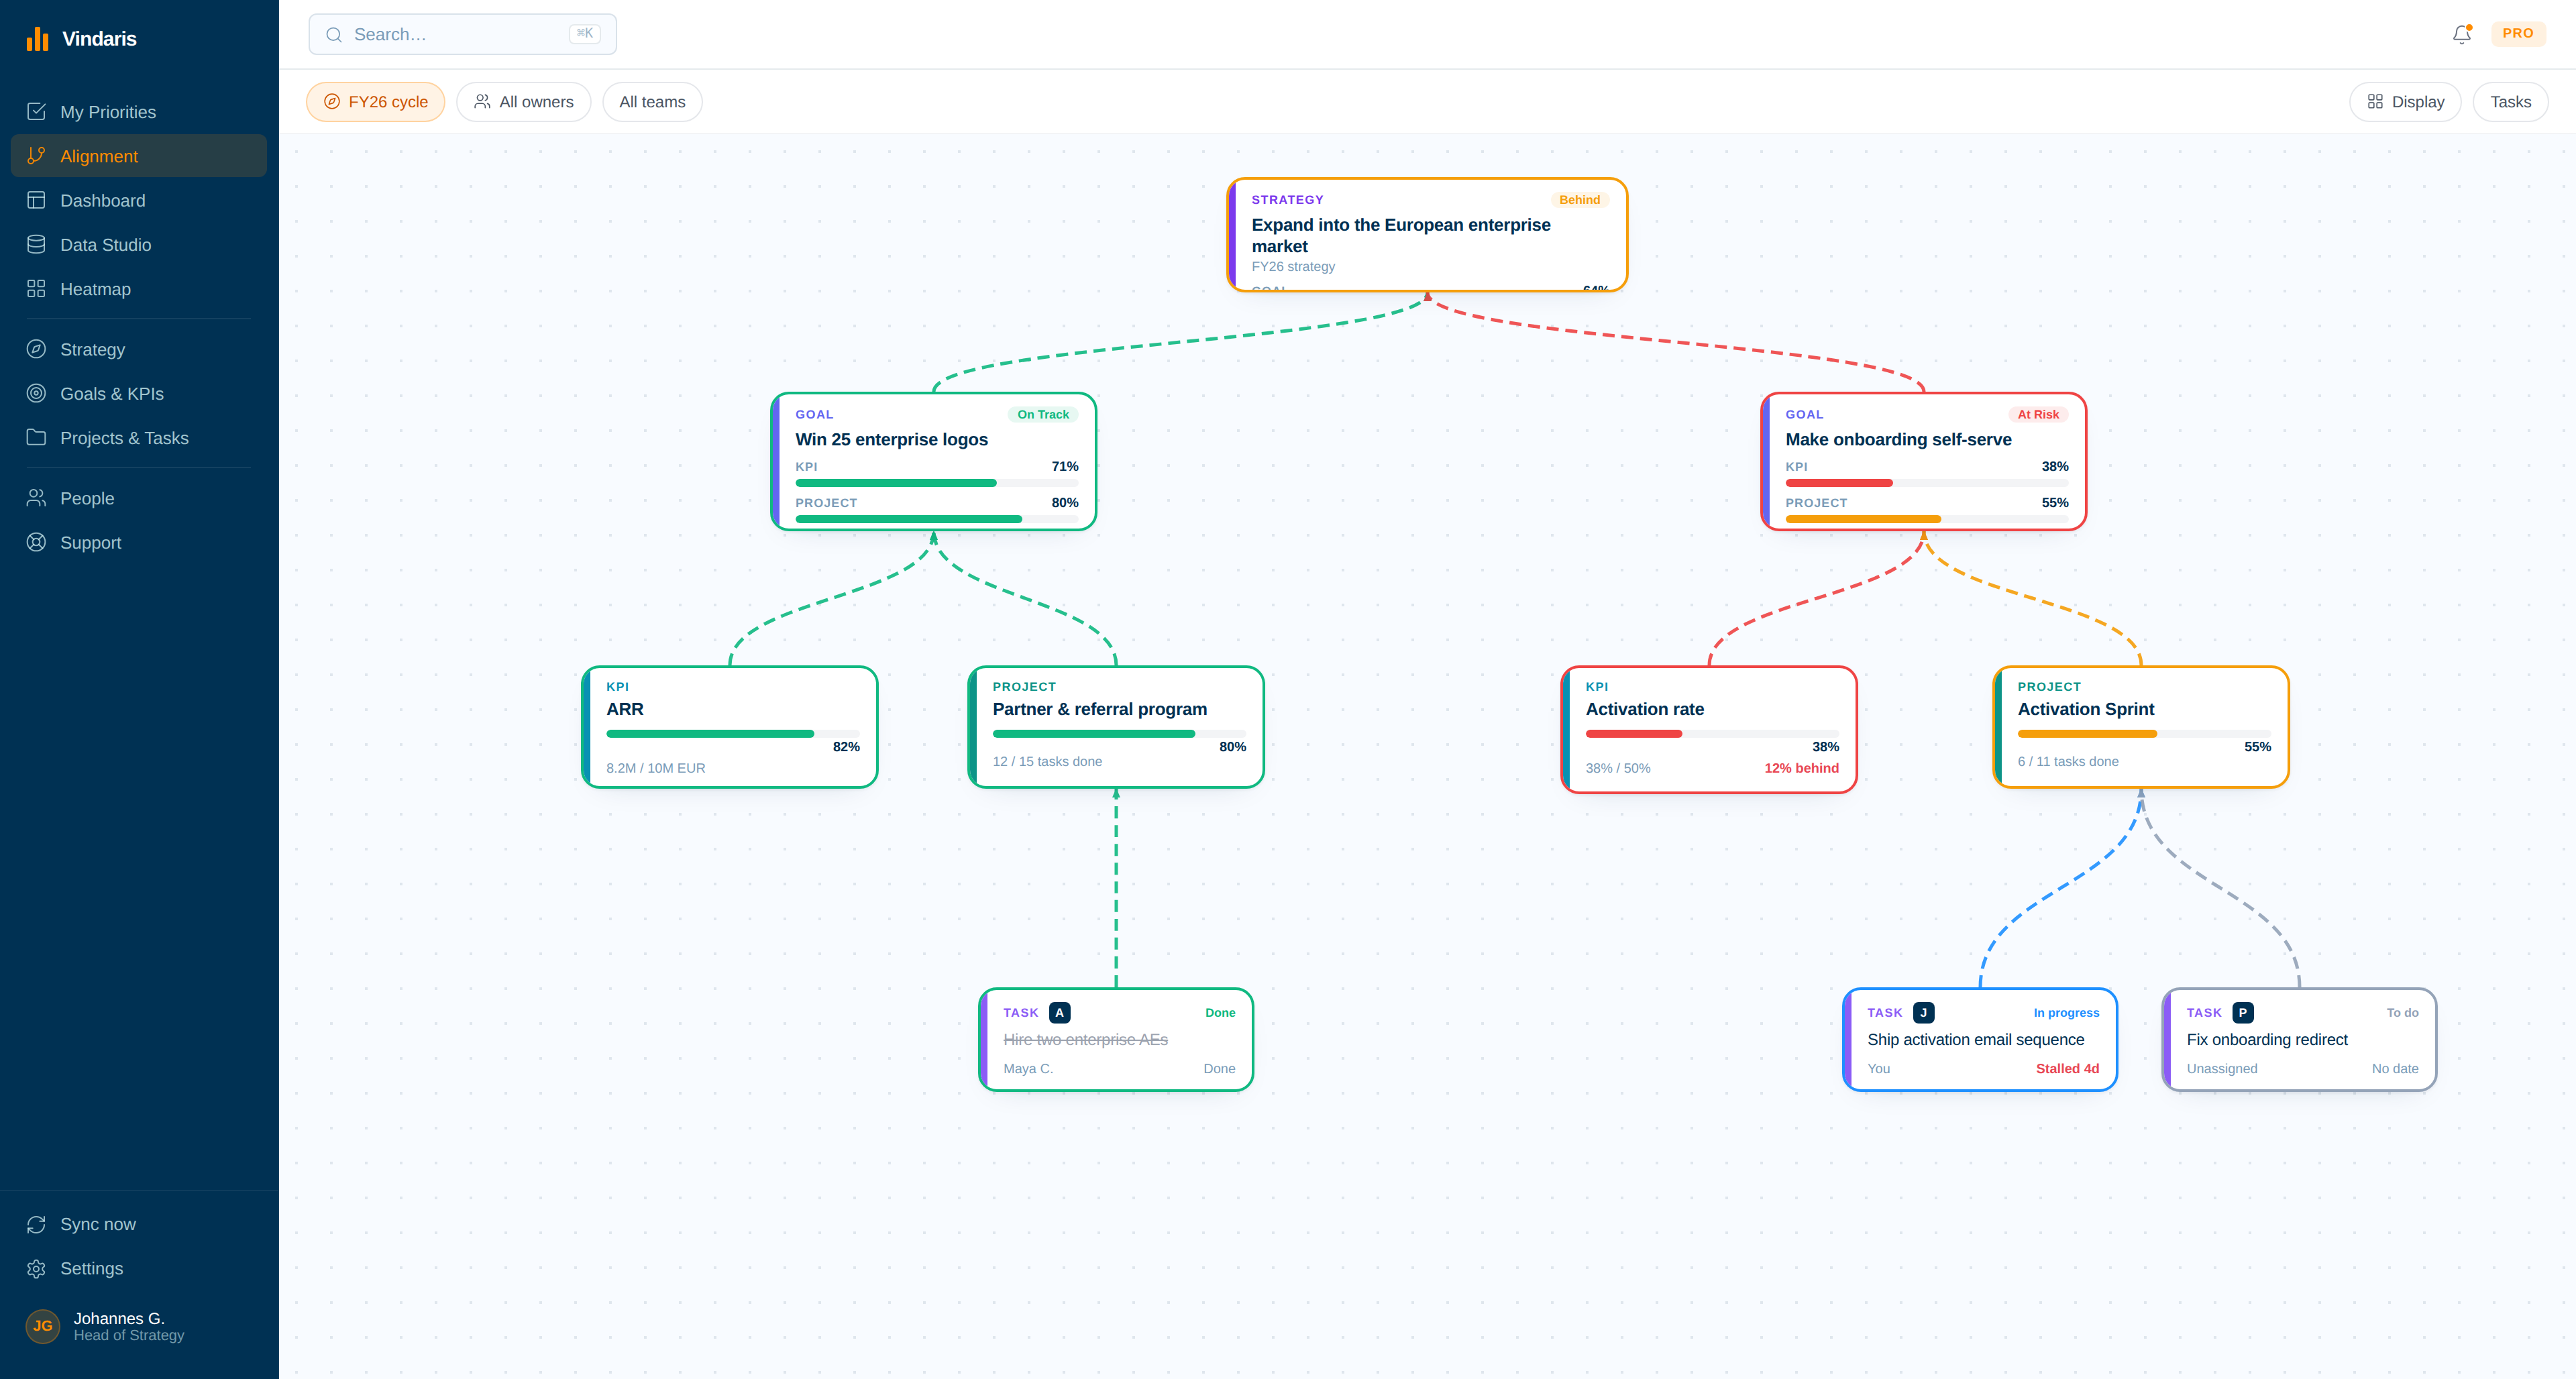
Every tracked KPI on one board with the projects and synced tasks meant to move it underneath. Click through the live workspace, no signup.
A KPI tracker for the moments that decide the quarter.
KPI tracking fails in a specific way: the number is technically current, and nobody knows it has quietly stopped being reachable.
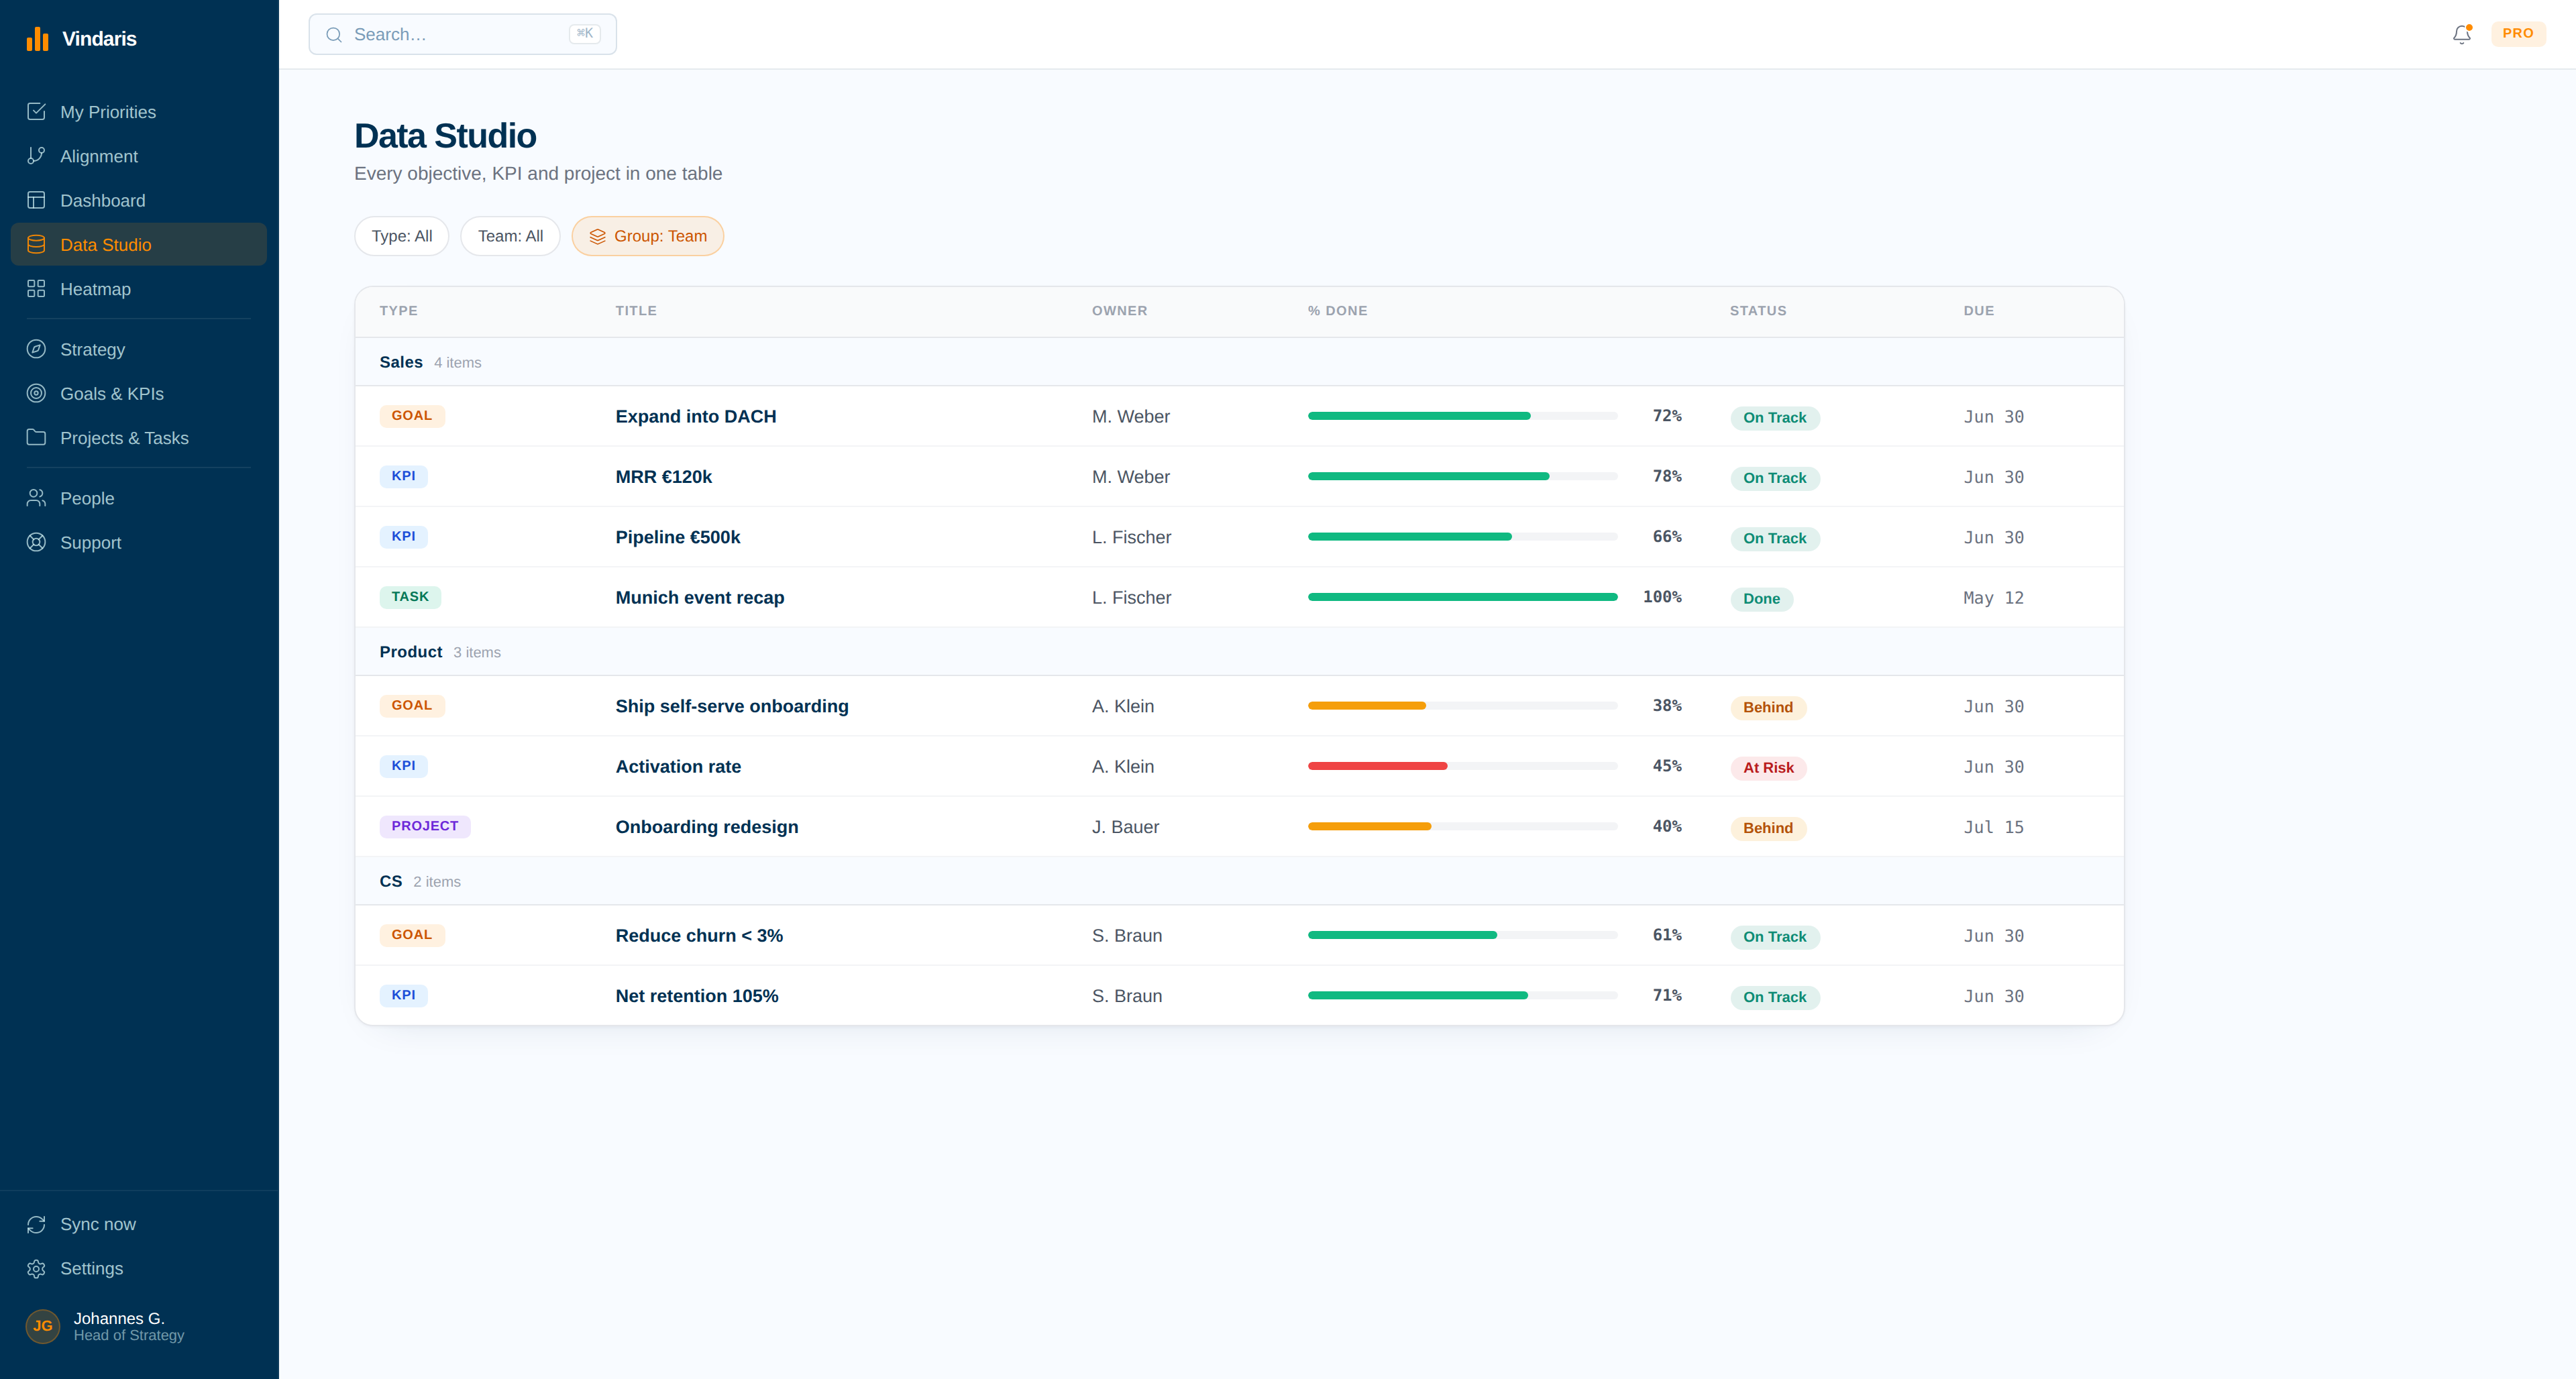
The number, and whether the work will hit it.
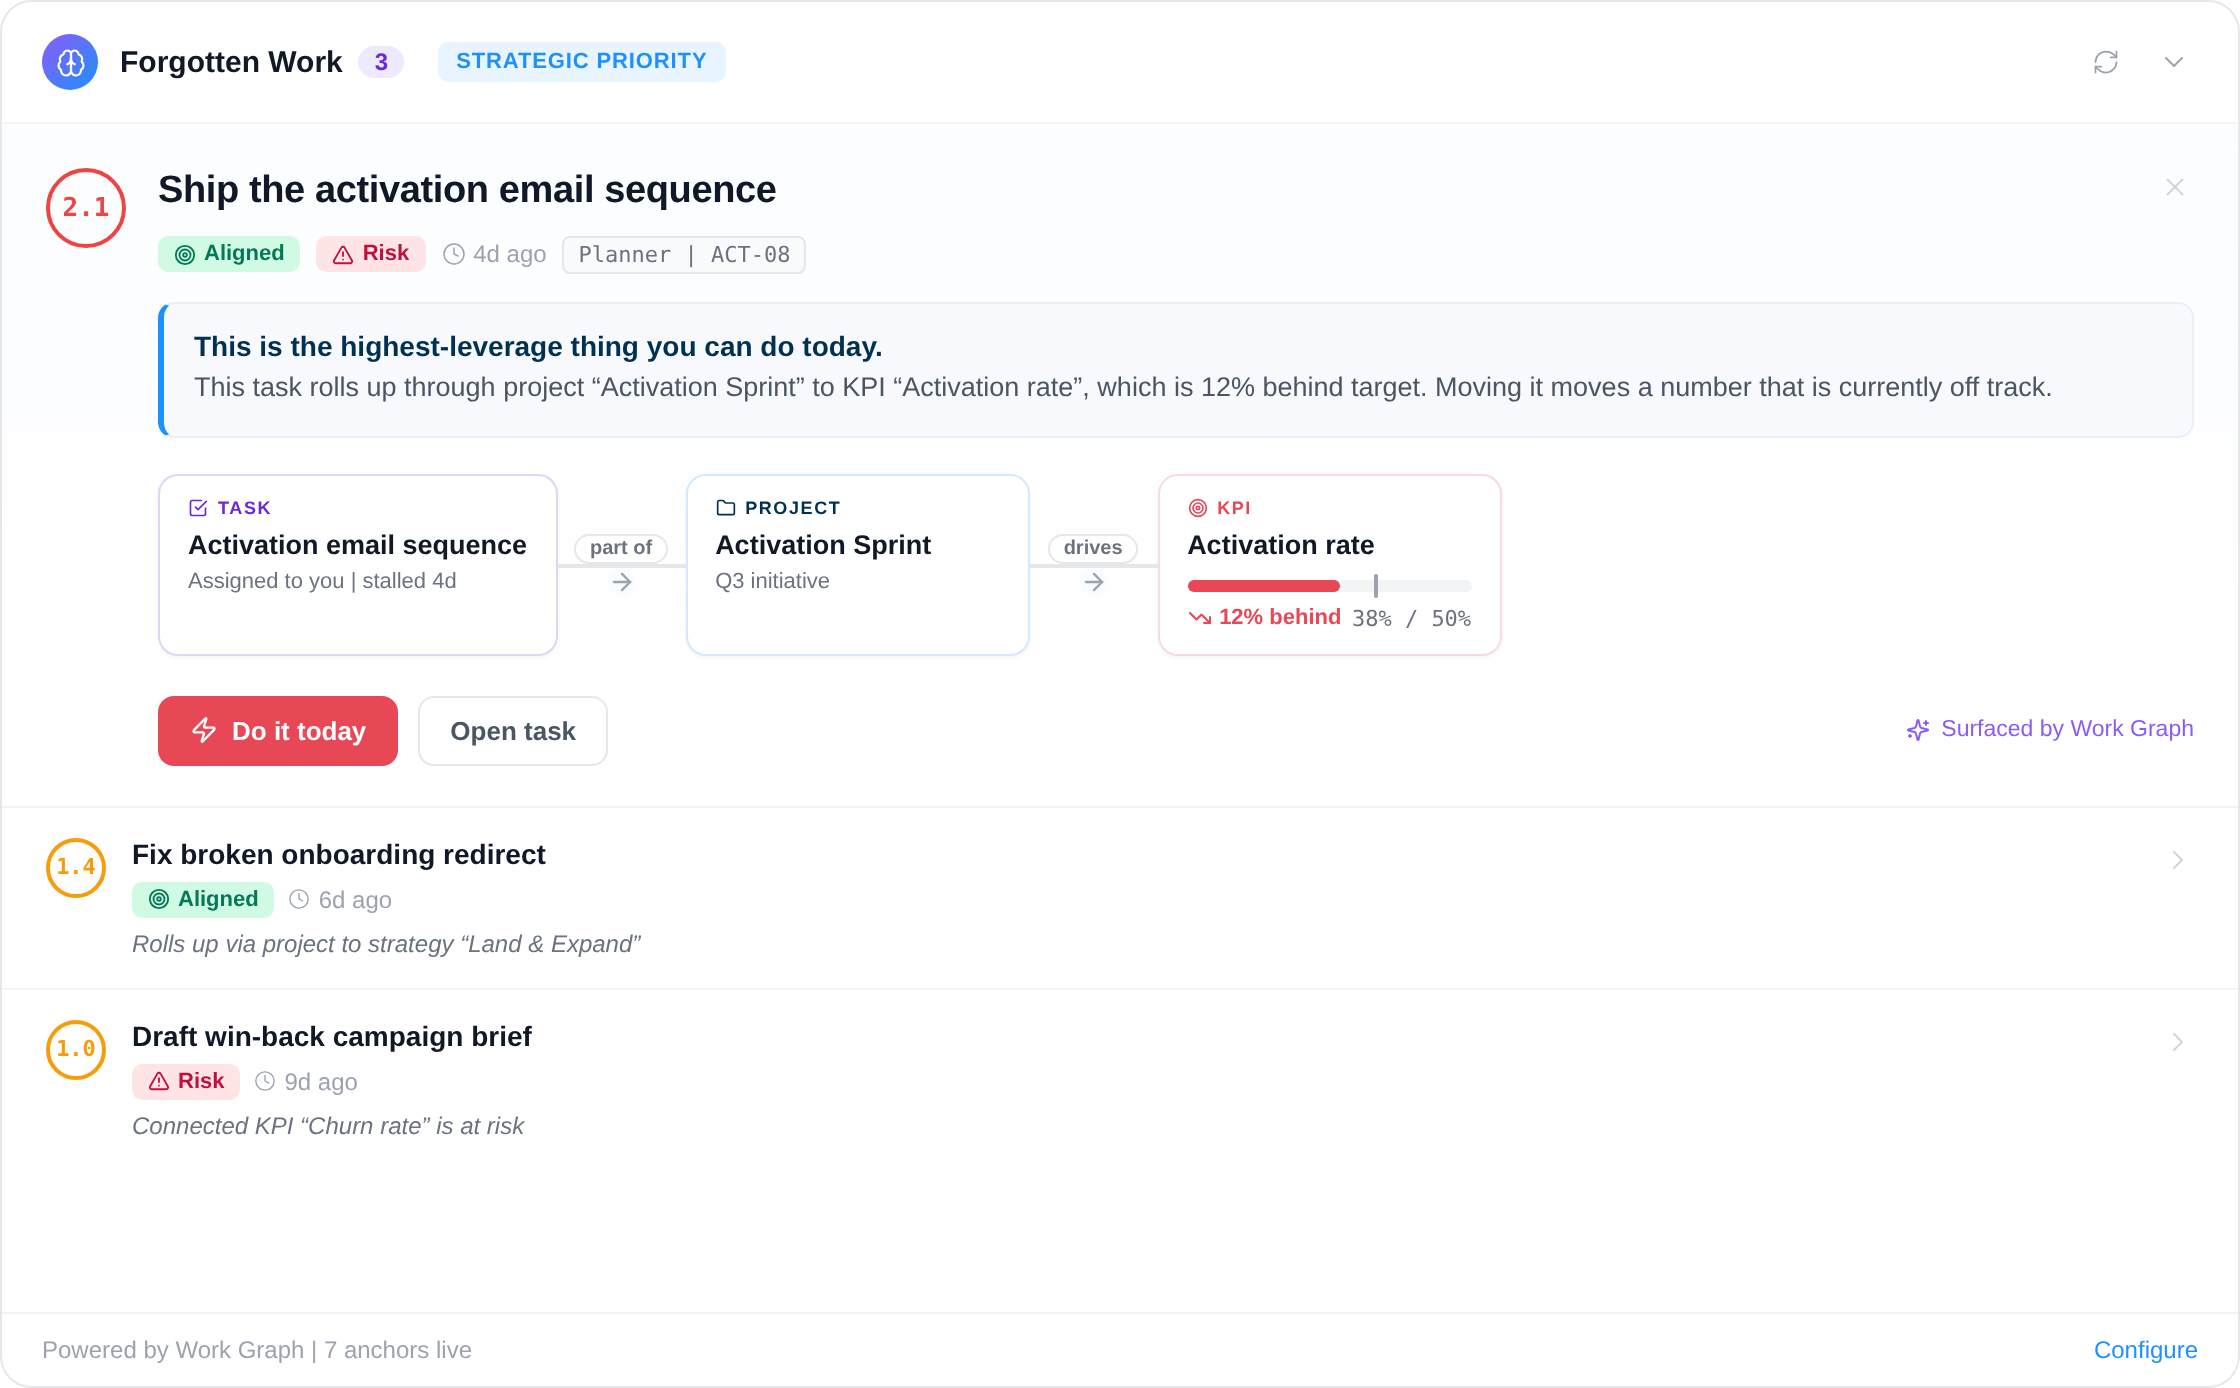
Every KPI tool shows the current value. The difference is the middle step: where the number comes from, and what warns you when it drifts. In Vindaris both are read from the work itself.
Execution risk, flagged as it forms
The Work Graph measures the rate of progress on the work behind each KPI against the target and its deadline, and flags the moment the number can no longer be reached at the current pace. That is weeks before the value itself turns red.
Down to the Slack thread
Other tools sync a progress percentage. Vindaris maps every KPI down to the individual tasks and reads the conversations around them, so a drifting number comes with its cause attached: the stalled task, the reassigned owner, the thread where scope changed.
Work stays where it lives
Connect HubSpot, Jira, Planner, Asana and Google Tasks. Teams keep working in their own tools while every synced task keeps a tag pointing at its source, so the KPI's pace is checkable rather than asserted.
Map strategy, goals and KPIs first
Lay out what you are trying to achieve and which KPIs prove it, down to the projects and tasks meant to move each number. The map is the part most KPI tools skip, and it is what makes every alert traceable.
- Write it in plain language and Vindaris maps it onto the canvas.
- Every KPI keeps a target, an owner and a deadline.
Connect the tools the work runs in
Plug in HubSpot, Microsoft Planner, Google Tasks, Asana or Jira. From here the KPI reads its pace from real activity, and there is nothing left for anyone to report.
- A task closed in Jira closes in Vindaris, and back again.
- Slack and Teams threads stay attached to the work they discuss.
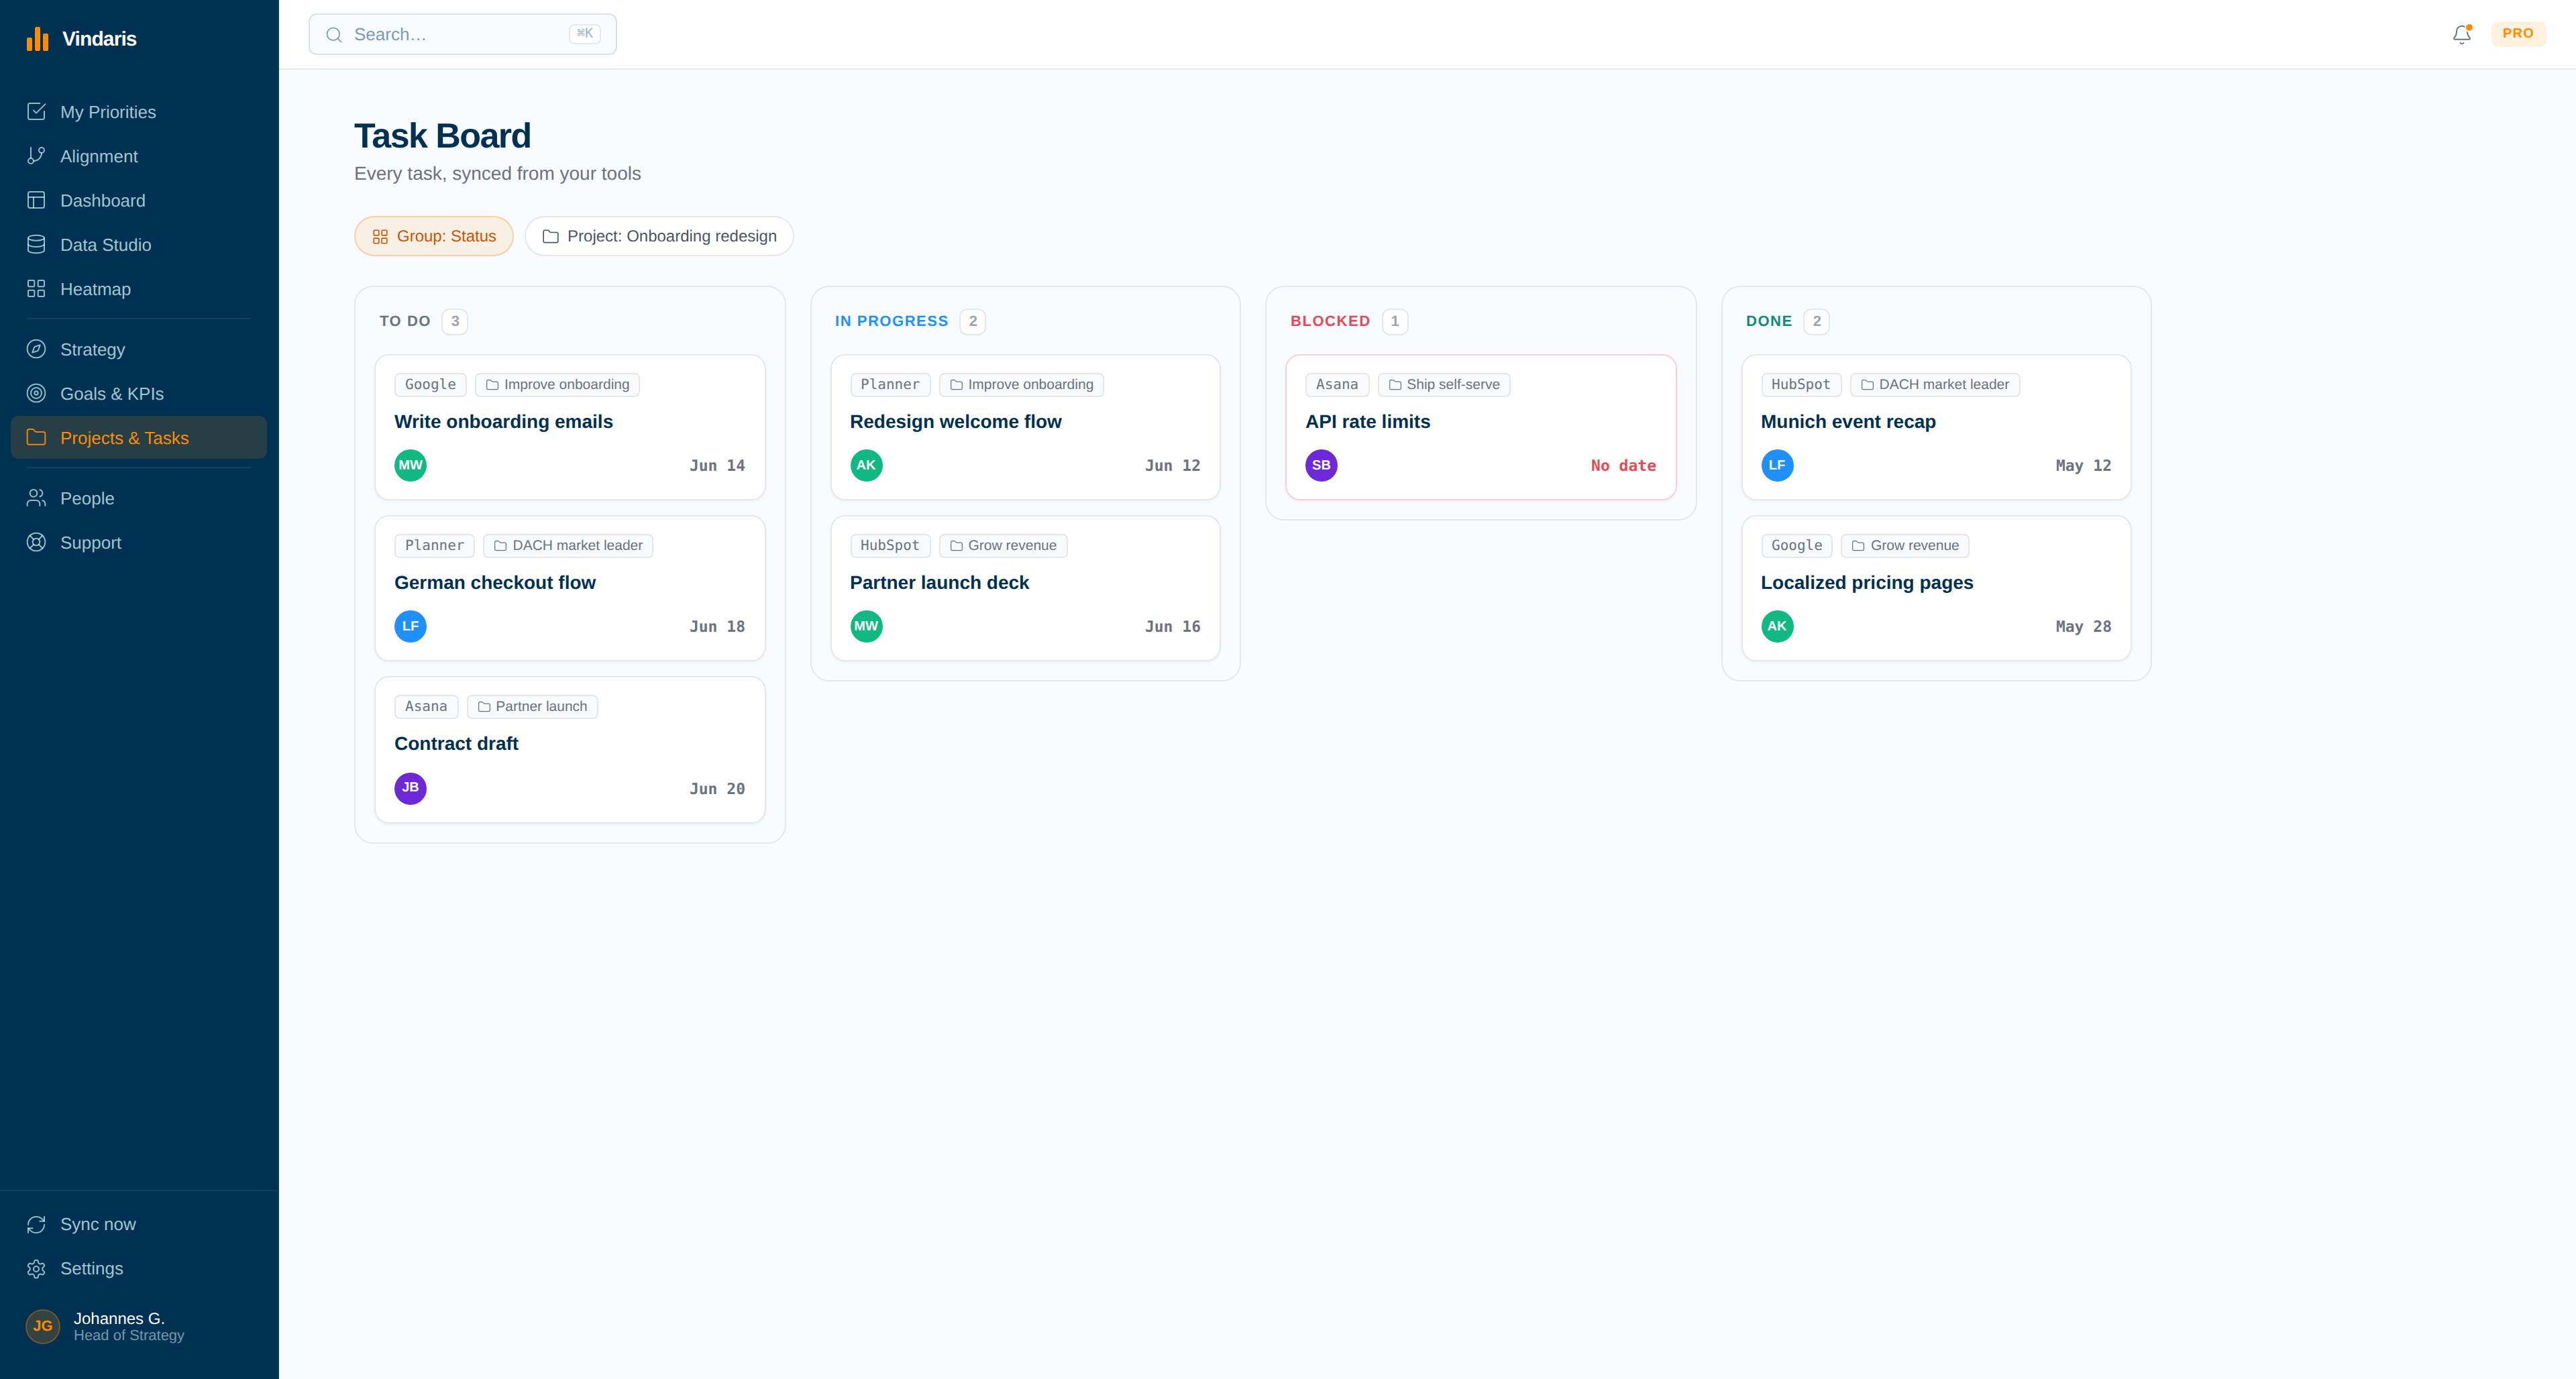
Build the KPI dashboard on live data
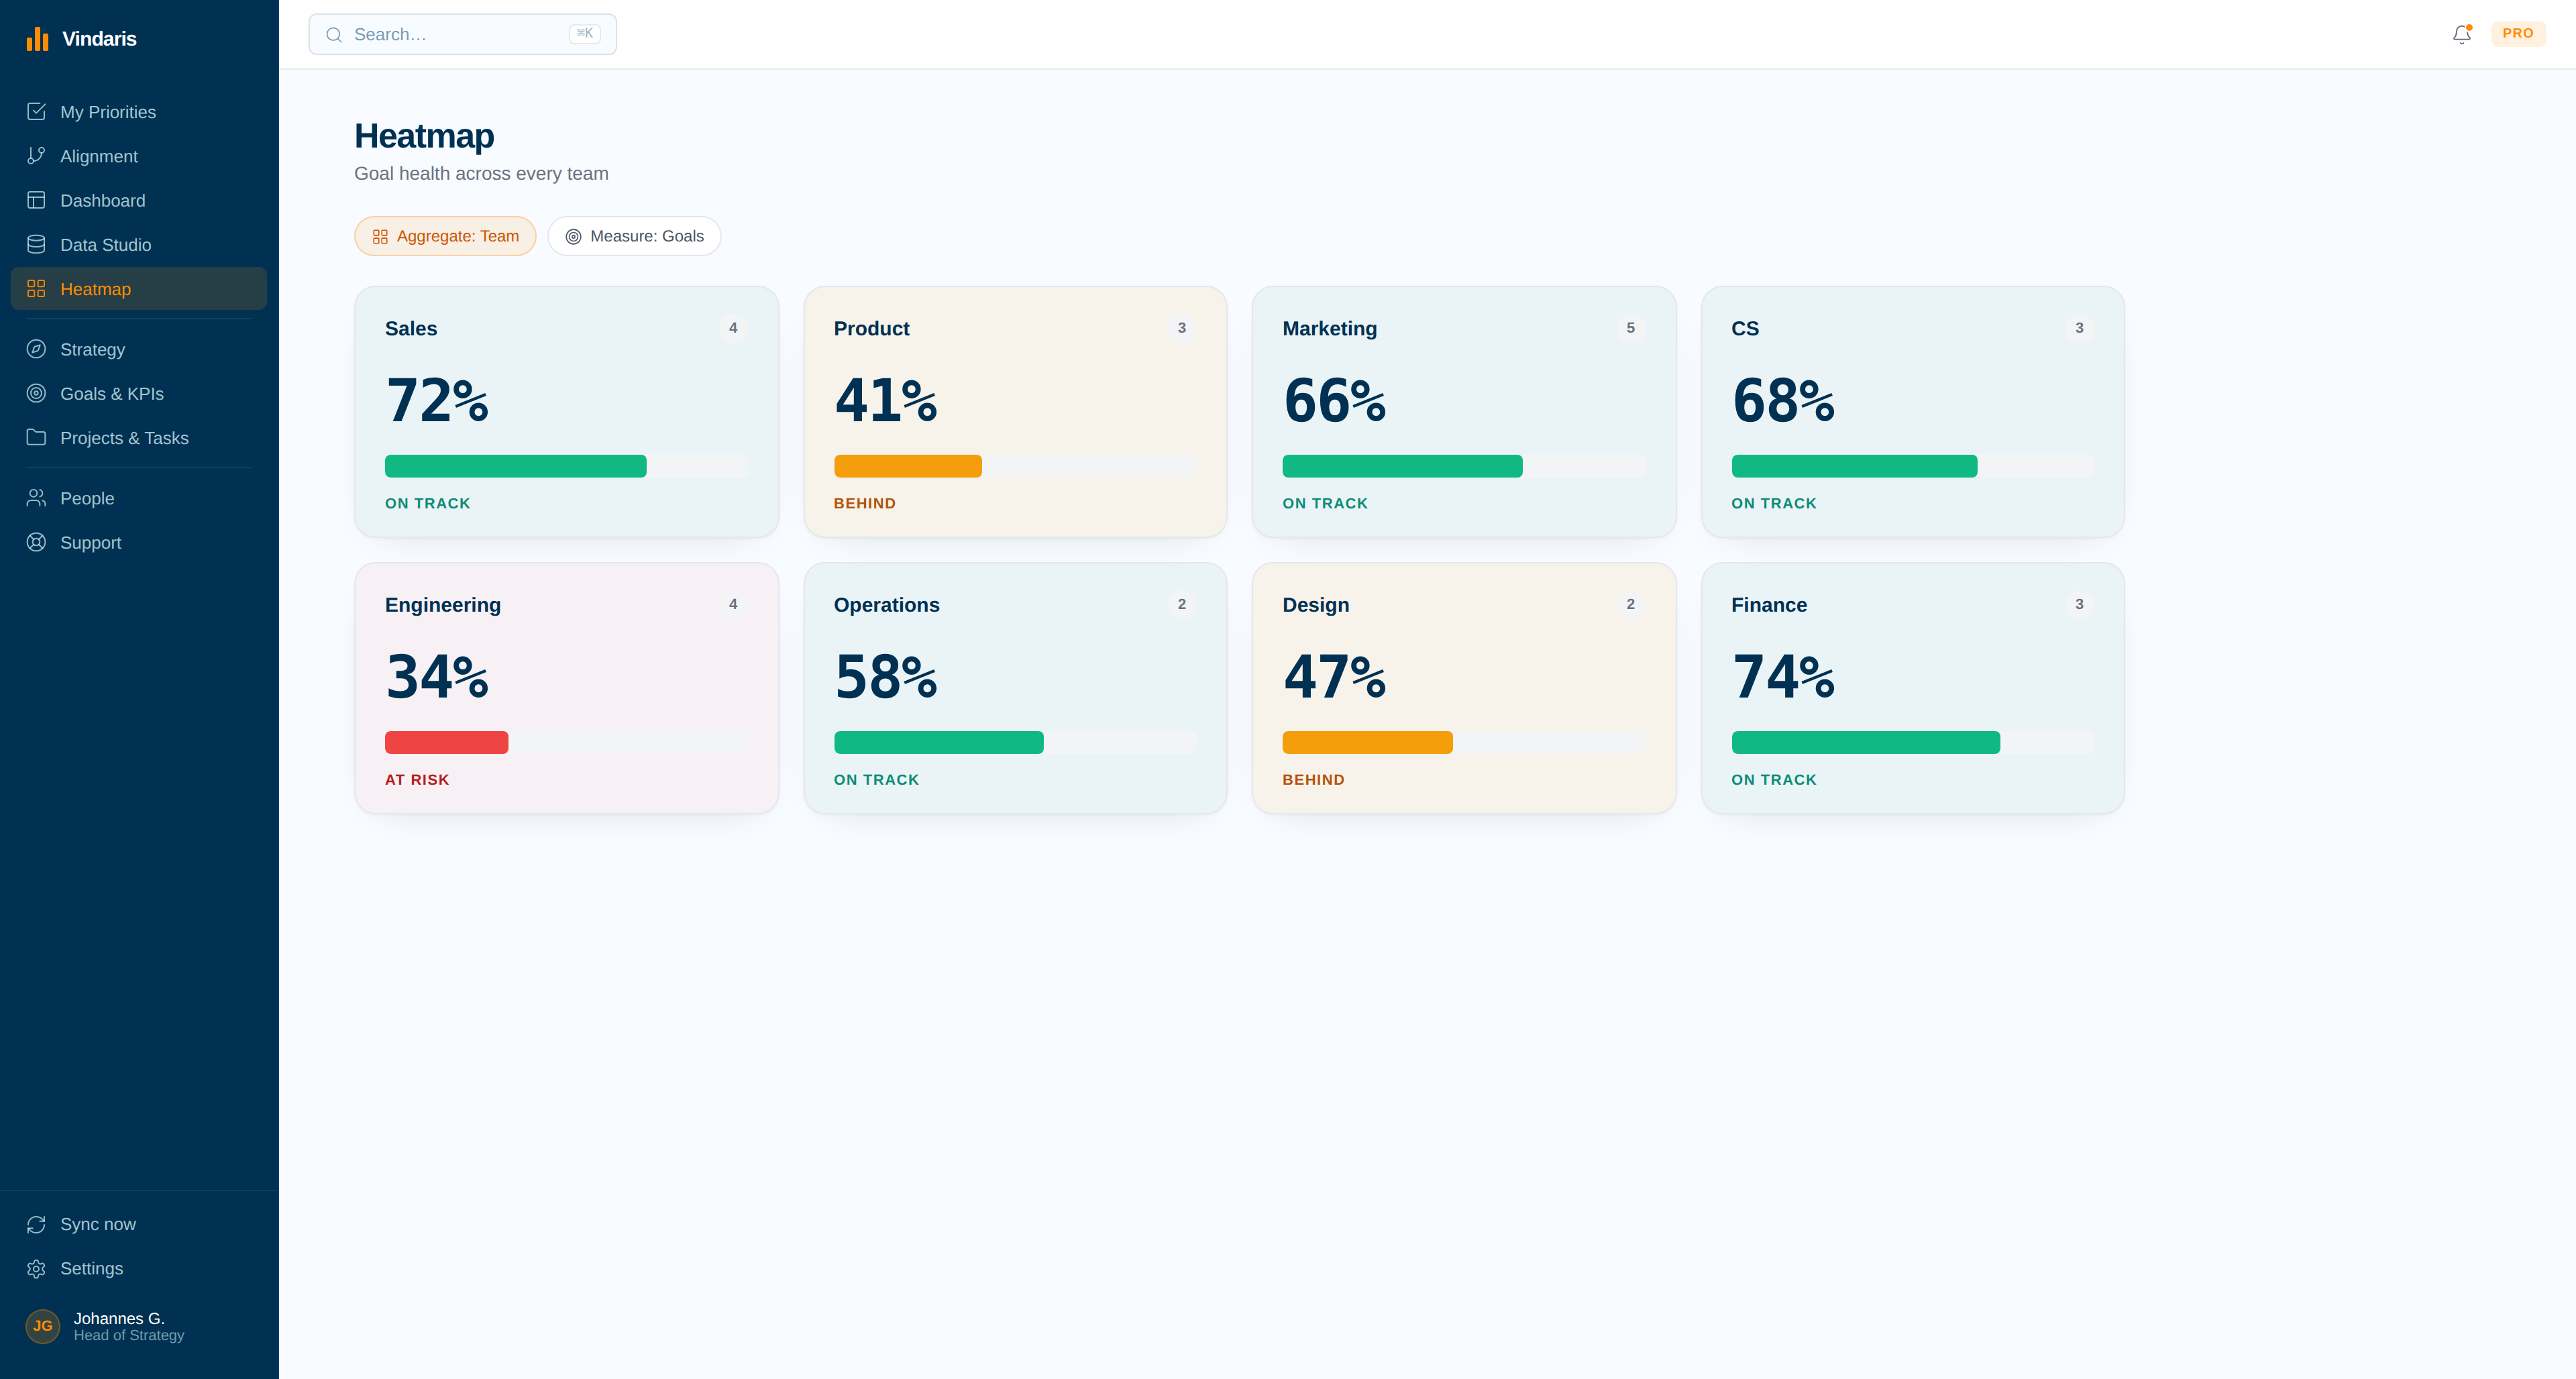
Drag-and-drop dashboards, data tables, heatmaps and timeline views over KPIs that are already current. Compare week over week or quarter over quarter, and schedule any view into Slack, Teams or email.
- Every widget clicks through to the work behind the number.
- Scheduled AI status reports summarize what moved and why.
Let the tracker do the worrying
Deterministic and AI-driven alerts watch the work behind each KPI for stalls, pace falling off and effort drifting elsewhere. The owner is told with the specific task named, rather than discovering it in the monthly review.
- A KPI that cannot hit at the current pace is flagged early.
- Scheduled summaries land in Slack, Teams or email.
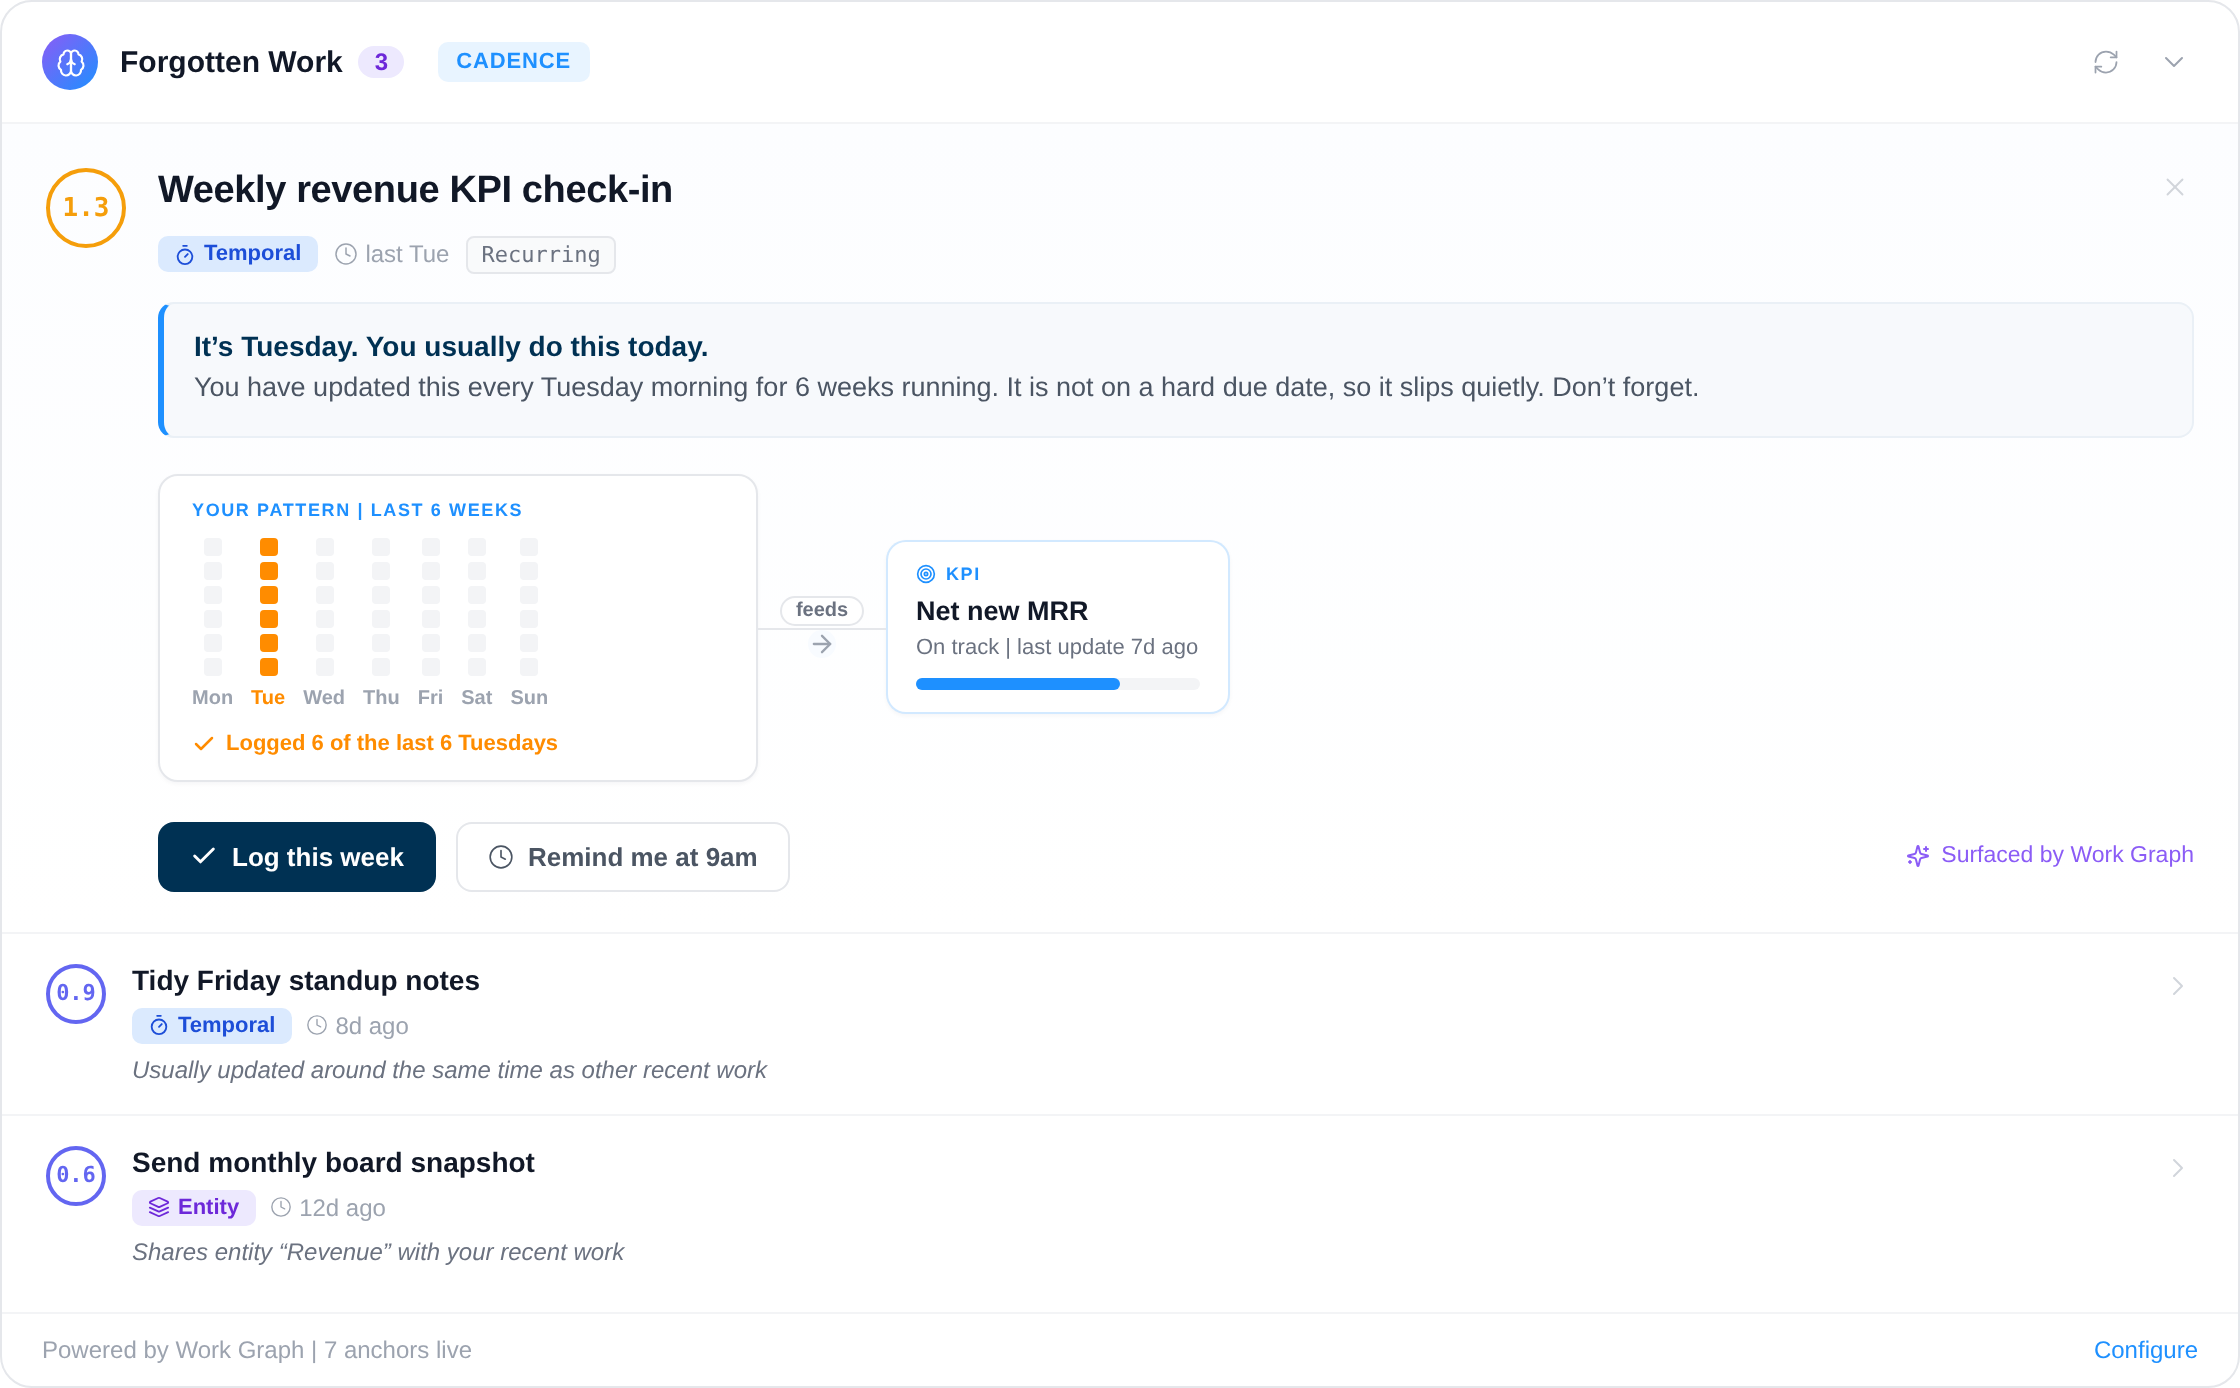
Reporting, scorecards and management in the same place.
Vindaris covers the whole KPI workflow: define the indicators next to the OKRs or goals they serve, track their pace from connected work, and report them without a collection round. If you are comparing approaches, OKR vs KPI explains where each fits, and the KPI glossary entry covers the basics. Examples of real views are on the KPI dashboard examples page.
KPI reporting without the reporting round
Save any view as a report and schedule it into Slack, Teams or email. Because the underlying KPIs read from connected work, the report that lands on Monday morning was not assembled by anyone on Friday afternoon.
A KPI scorecard that stays current
Group KPIs by team or goal with value, target and pace side by side. The scorecard is a view over live data rather than a document, so the version leadership sees and the version the team sees are the same one.
KPI management across every framework
KPIs rarely live alone. Vindaris holds them beside OKRs, EOS scorecards, SMART goals and Balanced Scorecard measures in one workspace, so the indicators keep their strategic context whichever framework each team runs.
Check one KPI's pace right now, free
The KPI pace checker takes a target, a current value, a deadline and recent progress, and answers whether the number will hit at the current pace. No account, no data stored, and the same question the Work Graph asks continuously.
Write the list once, never maintain it.
Type the goals you want tracked and who owns them, tag them with @, and the structure appears with the connected work already hanging underneath. Nothing about it needs updating afterwards.
Alerts, so a slipping KPI says so.
A KPI dashboard is silent between reviews. These are the alerts that break the silence, each one tied to the work behind the number rather than to the number alone.
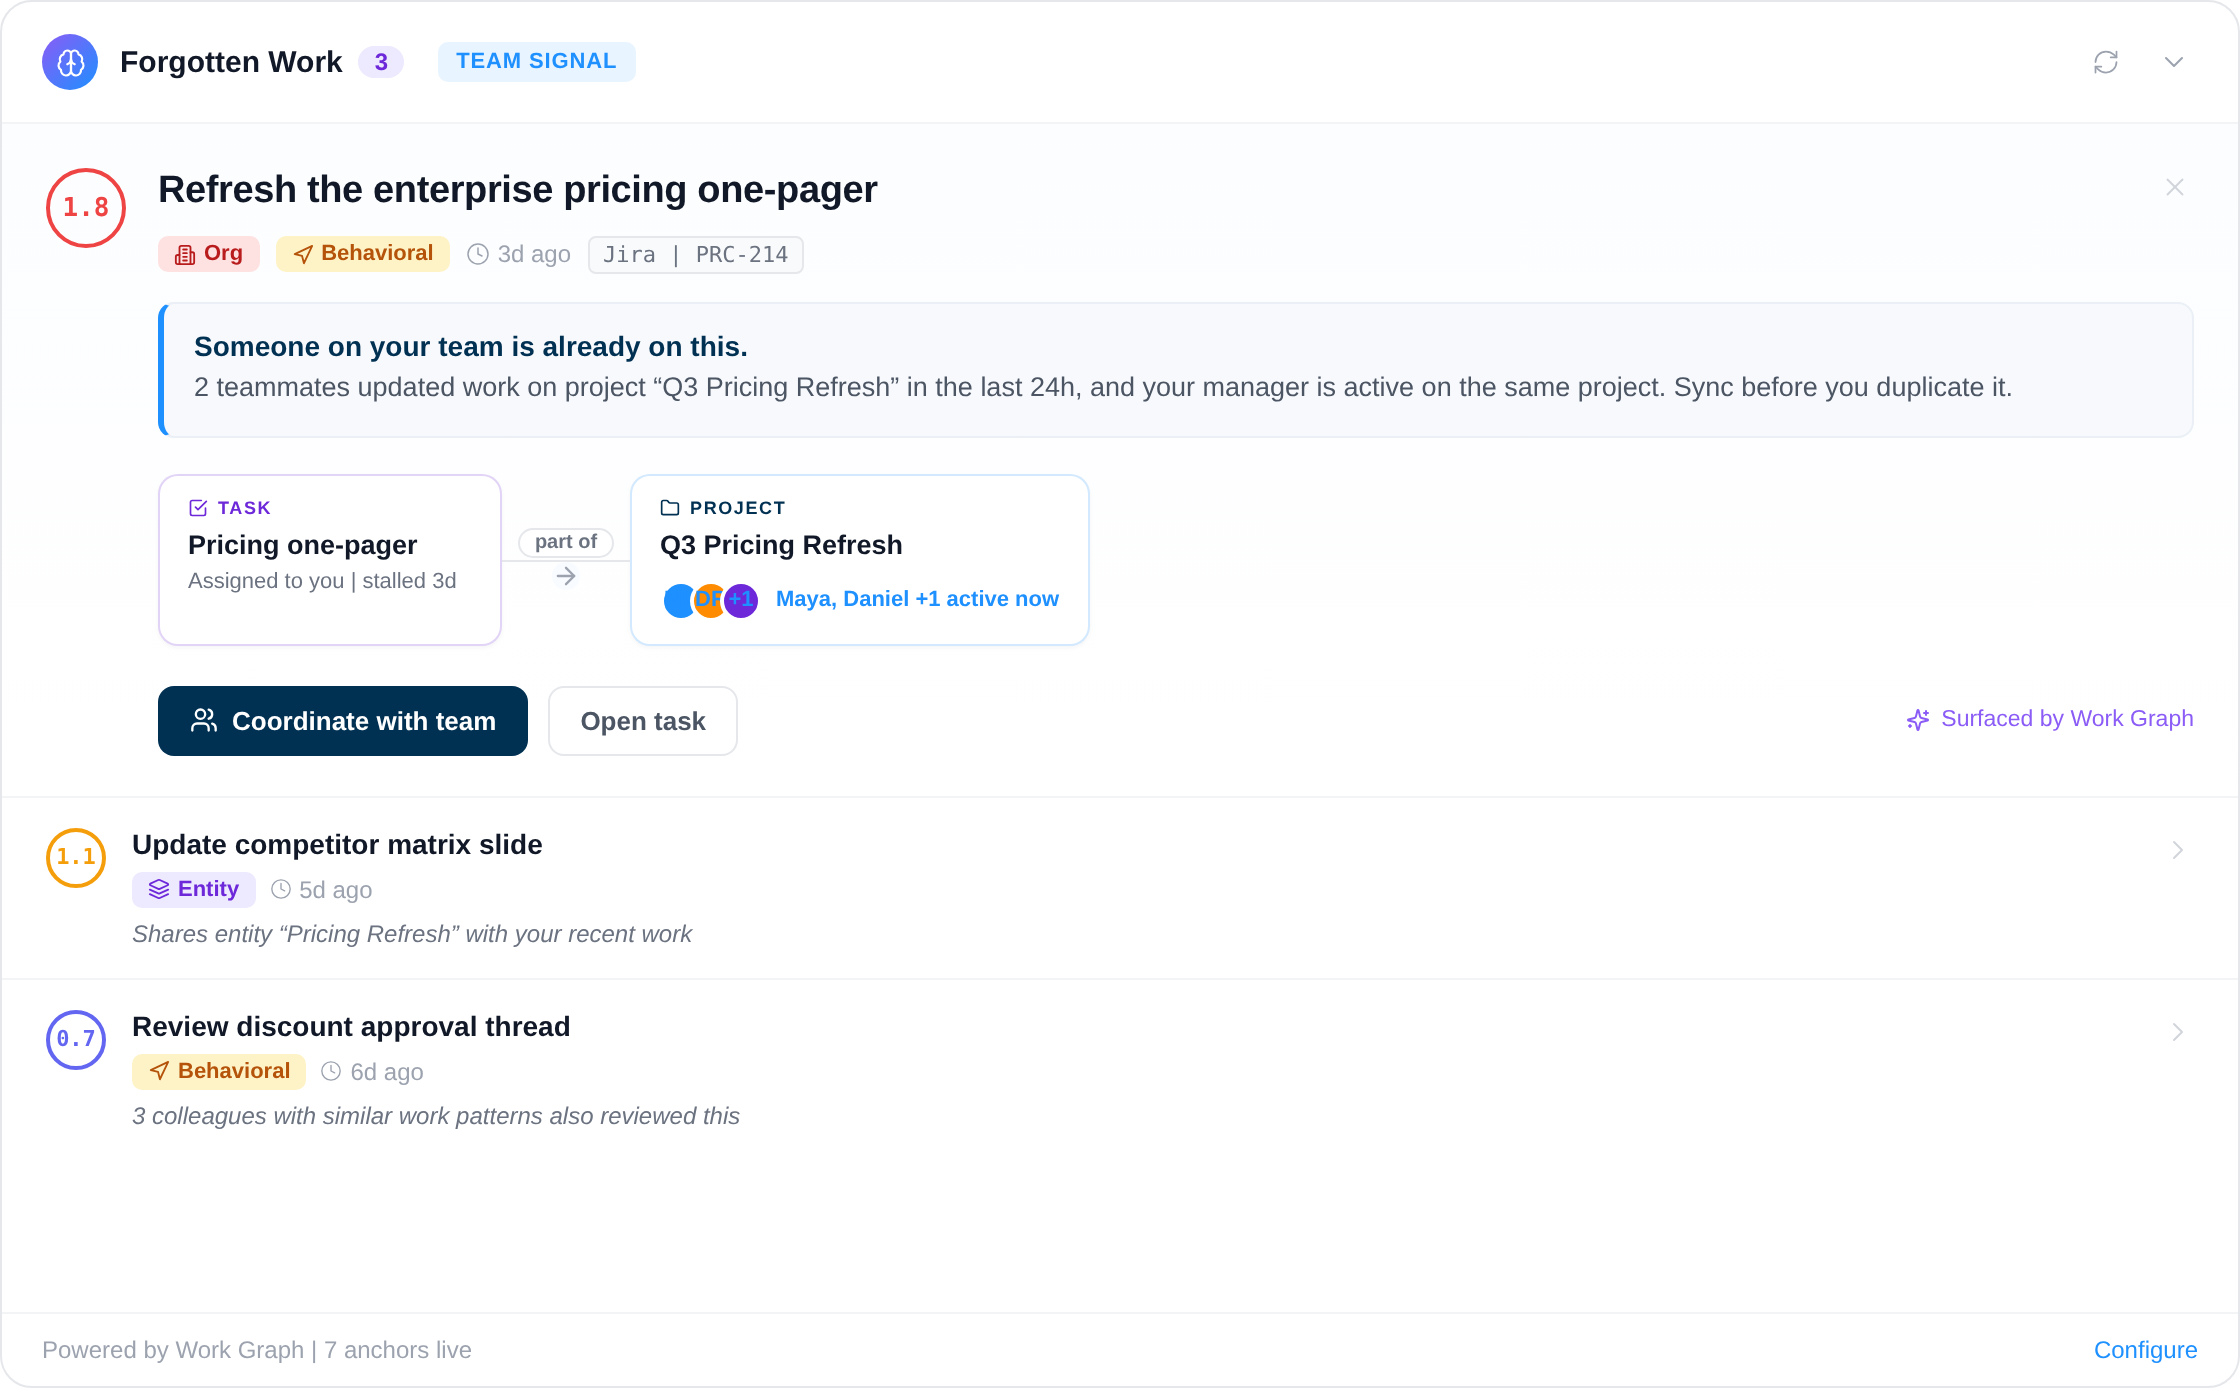
Deterministic and AI-driven alerts watching for slipping pace, broken routines and misaligned focus.
Your framework, your language, your data in Europe.
Vindaris fits whichever goal syntax your teams already use, because the tracking problem is the same underneath and switching syntax should not mean switching tools.
Tracks goals in any framework
Vindaris ships without a prescribed methodology, so OKRs, KPIs, SMART goals and EOS Rocks are all tracked the same way in one workspace. Teams keep the format that suits them while leadership keeps a single connected view of progress.
Your data stays in Europe
Vindaris runs in a Hetzner data center in Nuremberg and was built around European data sovereignty from the start. Procurement and your DPO will find the answers they need in the trust center.
Free forever, including two integrations.
Free is a working tracker for a team of five, with two integrations and automatic progress. It is not a fourteen-day window, and there is no card to enter.
Best for individual contributors, small teams or startups. No credit card required.
- All views: Canvas, My Priorities, Heatmap, Data Studio and Task Board
- Two integrations of your choice
- Up to four additional members
- Five ad-hoc AI risk summaries per month
Best for teams, small agencies, or departmental and team management.
- Everything in Free
- All integrations, unlimited sync
- Unlimited AI risk summaries and alignment suggestions
- Up to ten users in one organization
Best for multiple teams, exec teams, Chiefs of Staff or full-org deployments.
- Everything in Connect
- Unlimited users in one organization
- Direct human support, 24h response
- Human-led onboarding
Check a KPI before you switch anything.
Browser tools and real Office files that run without an account. Most teams start with the pace checker on one worrying number and move once the manual version stops scaling.
Common questions, answered
What is KPI tracking software?
KPI tracking software monitors key performance indicators against their targets over time. Vindaris is KPI tracking software that also connects each KPI to the projects and tasks meant to move it, so alongside the current value you see whether the work behind the number is actually on pace to reach the target.
How does automatic KPI tracking work?
Each KPI connects to the projects and tasks meant to move it through bidirectional sync with tools like HubSpot, Jira, Planner and Asana. Vindaris measures the pace of that work against the target and its deadline, so the KPI's status is derived from real activity rather than typed into a field before a review.
What is the difference between a KPI and a metric?
Every KPI is a metric, but only the handful of metrics tied to a strategic target count as key performance indicators. A metric describes something; a KPI carries a commitment, an owner and a deadline. Tracking hundreds of metrics is a dashboard; tracking the few KPIs against their targets is management.
What is KPI reporting software?
KPI reporting software turns tracked KPIs into recurring reports for leadership. In Vindaris any Data Studio view can be saved as a report and scheduled into Slack, Teams or email, with week-over-week and quarter-over-quarter comparison built in, so the reporting round stops being an assembly exercise.
Can Vindaris work as a KPI scorecard?
Yes. Build a scorecard view with each KPI's current value, target and pace, grouped by team or by goal. Because every KPI reads from the work connected beneath it, the scorecard stays current without anyone filling it in before the weekly meeting.
Is there a free KPI tracker?
Yes. Vindaris is free forever for up to five users, including two integrations and the full set of views, with no credit card. There is also a free KPI pace checker that answers the single question of whether one KPI will hit its target at the current pace, with no account at all.
What is KPI management?
KPI management covers choosing the right indicators, setting targets and owners, tracking pace against those targets, and acting when a number drifts. Software helps most with the last two steps: continuous pace measurement and an alert when a KPI can no longer be reached at the current rate of progress.
Stop reporting KPIs by hand. Read them from the work.
Connect your first tool in 90 seconds. Free forever up to five users.
Start tracking KPIs freeNo credit card | No migration | No minimum contract