Work Graph
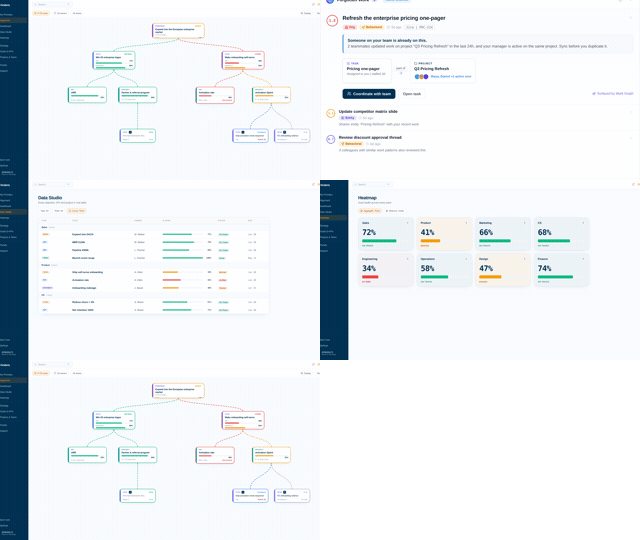
A work graph is a live data structure that connects an organization's work into one graph: tasks to projects, projects to goals, goals to KPIs and strategic themes, and all of it to the teams and people involved. Asana popularized the term for the work layer; a strategy-level work graph extends the edges upward to the goals the work is supposed to move.
Asana coined the term to describe how units of work relate to the people responsible for them and to the work around them. That graph solves coordination inside the work layer: who is doing what, what depends on what, what is blocked. Its edges run sideways, between pieces of work.
A strategy-level work graph adds the vertical edges. Each task connects upward through its project to a goal, a KPI and a strategic theme, and the edges are maintained automatically from activity in the connected tools rather than by hand. On that structure, questions that normally wait for a review have live answers: which goals have no active work behind them, which team's effort maps to no current priority, which KPI cannot be reached at the current pace. This is the structure on which execution risk becomes detectable. The Vindaris Work Graph reads pace and focus along these edges and flags the misalignment as it forms.
A KPI owner asks why the number went flat. In a work graph, the KPI's edges lead to two connected projects: one was reassigned, the other has had no activity for three weeks. The same question asked of a dashboard waits for the next status update.
See where effort has drifted from your goals
Vindaris runs OKRs, KPIs, EOS, OGSM, SMART goals, the Balanced Scorecard, and Hoshin Kanri in one place, with the Work Graph flagging execution risks across all of them. Start free, no credit card.
Sign Up for Free